- Token Terminal
- Posts
- Getting started with tokenized assets
Getting started with tokenized assets
A guide for institutional investors
Tokenized assets represents the fastest-growing corner of onchain finance.
Investors, builders, or researchers that want to track the performance of these assets rigorously - across issuers, chains, and asset types - need to work with a dataset that is both complete in coverage and comparable in methodology.
This guide walks through the tokenized assets dataset on Token Terminal: what's covered, how assets are categorized, and what each metric actually measures.
Coverage
The dataset is updated daily. Here's where things stand today:
230 issuers
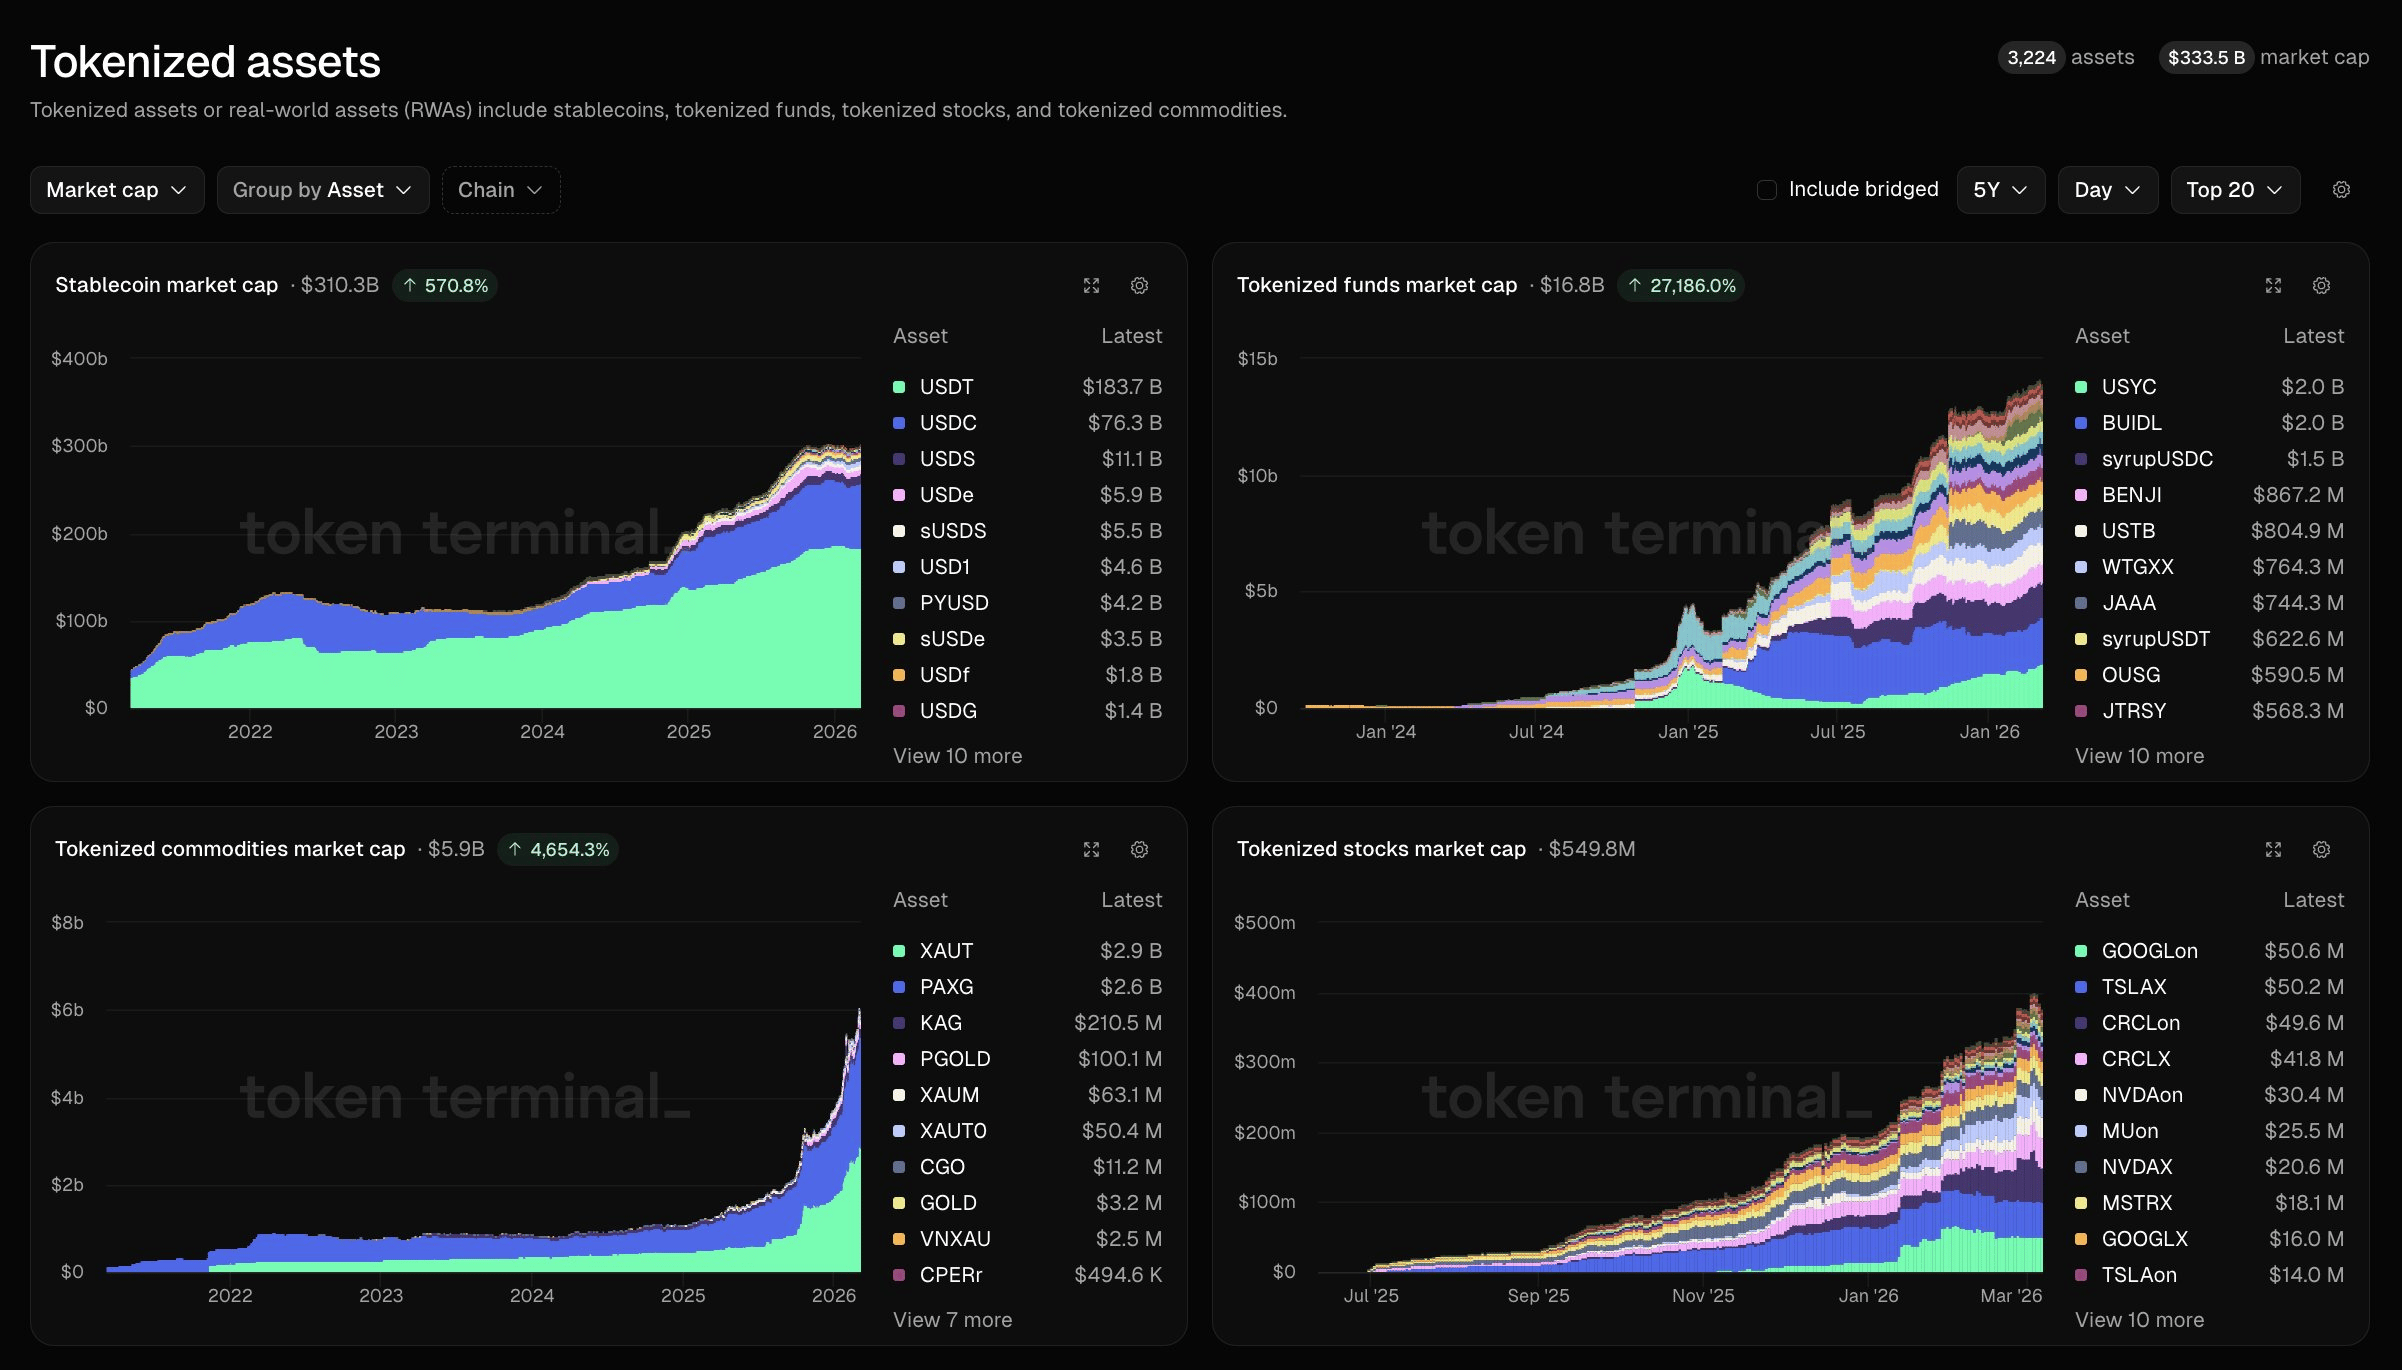
3,224 assets
4,267 asset deployments (grouped by chain)
109 chains
Not yet listed? Reach out and we'll get you added.
Market sectors
Currently, every tokenized asset falls into one of four categories:
Stablecoins. An asset designed to maintain a fixed peg, held primarily for transacting, collateral, or capital preservation purposes. Example reference asset: USDC → U.S. dollar.
Tokenized funds. An asset representing a share in a managed portfolio or strategy, held primarily for yield, diversification, or access to otherwise inaccessible asset classes. Example reference asset: BUIDL → U.S. T-bill.
Tokenized stocks. An asset representing equity ownership, held primarily for capital appreciation and/or dividend income. Example reference asset: NVDAon → NVDA.
Tokenized commodities. An asset representing physical or synthetic commodity exposure, held primarily for portfolio diversification, inflation hedging, or speculative purposes. Example reference asset: XAUT → Gold.
Metrics
Every tokenized asset is tracked across 11 standardized metrics and ratios thereof. Here's what each one measures and why it matters.
1. Circulating asset market cap. Measures the total USD value of all tokens currently in circulation. The headline size metric. Use this to compare scale across assets and issuers.

2. Asset price. Measures the current USD value of a single token. Straightforward, but essential context for interpreting volume and cap figures.

3. Asset off peg. Measures the percentage deviation of the asset's current price from its target value. Critical for stablecoins and tokenized funds. A persistent off-peg signal warrants closer scrutiny of the issuer or redemption mechanism.

4. Asset holders. Measures the number of unique addresses currently holding the asset. A proxy for adoption breadth. Useful for comparing distribution across competing assets.

5. Asset transfer volume. Measures the total USD value of all onchain transfers of the asset in a given period. The best single indicator of how actively an asset is being used, not just held.

6. Asset transfer count. Measures the total number of onchain transfers of the asset in a given period. Pairs with transfer volume to distinguish between a few large transactions and broad retail activity.

7. Asset mints. Measures the total USD value of new tokens issued in a given period. Rising mints signal growing demand. Useful for tracking issuer momentum.

8. Asset redemptions. Measures the total USD value of tokens burned or redeemed in a given period. Watch the mints-to-redemptions ratio. Sustained outflows can be an early warning signal.

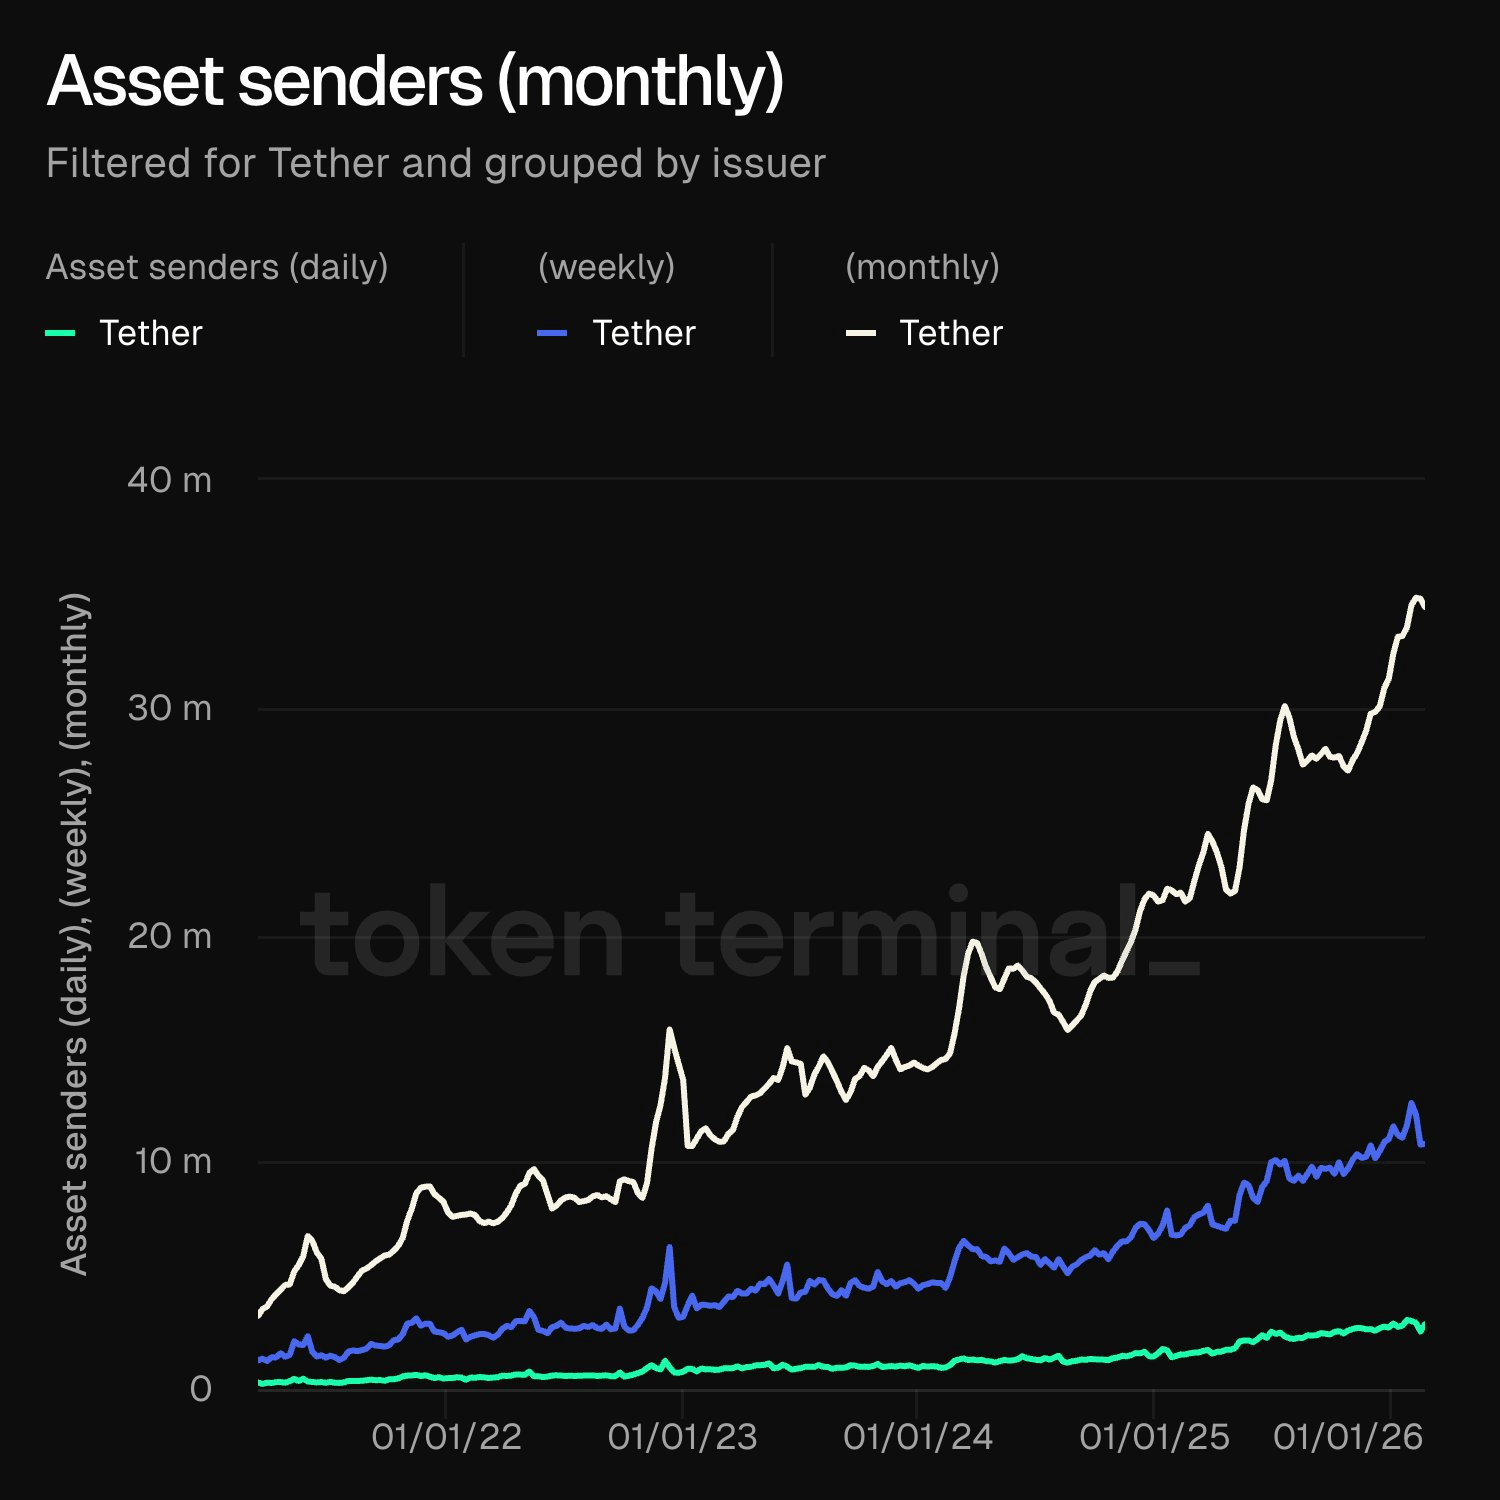
9. Asset senders (daily). Measures the number of unique addresses that initiated a transfer of the asset in the past 24 hours. Short-term activity pulse. Useful for spotting sudden spikes or drop-offs.

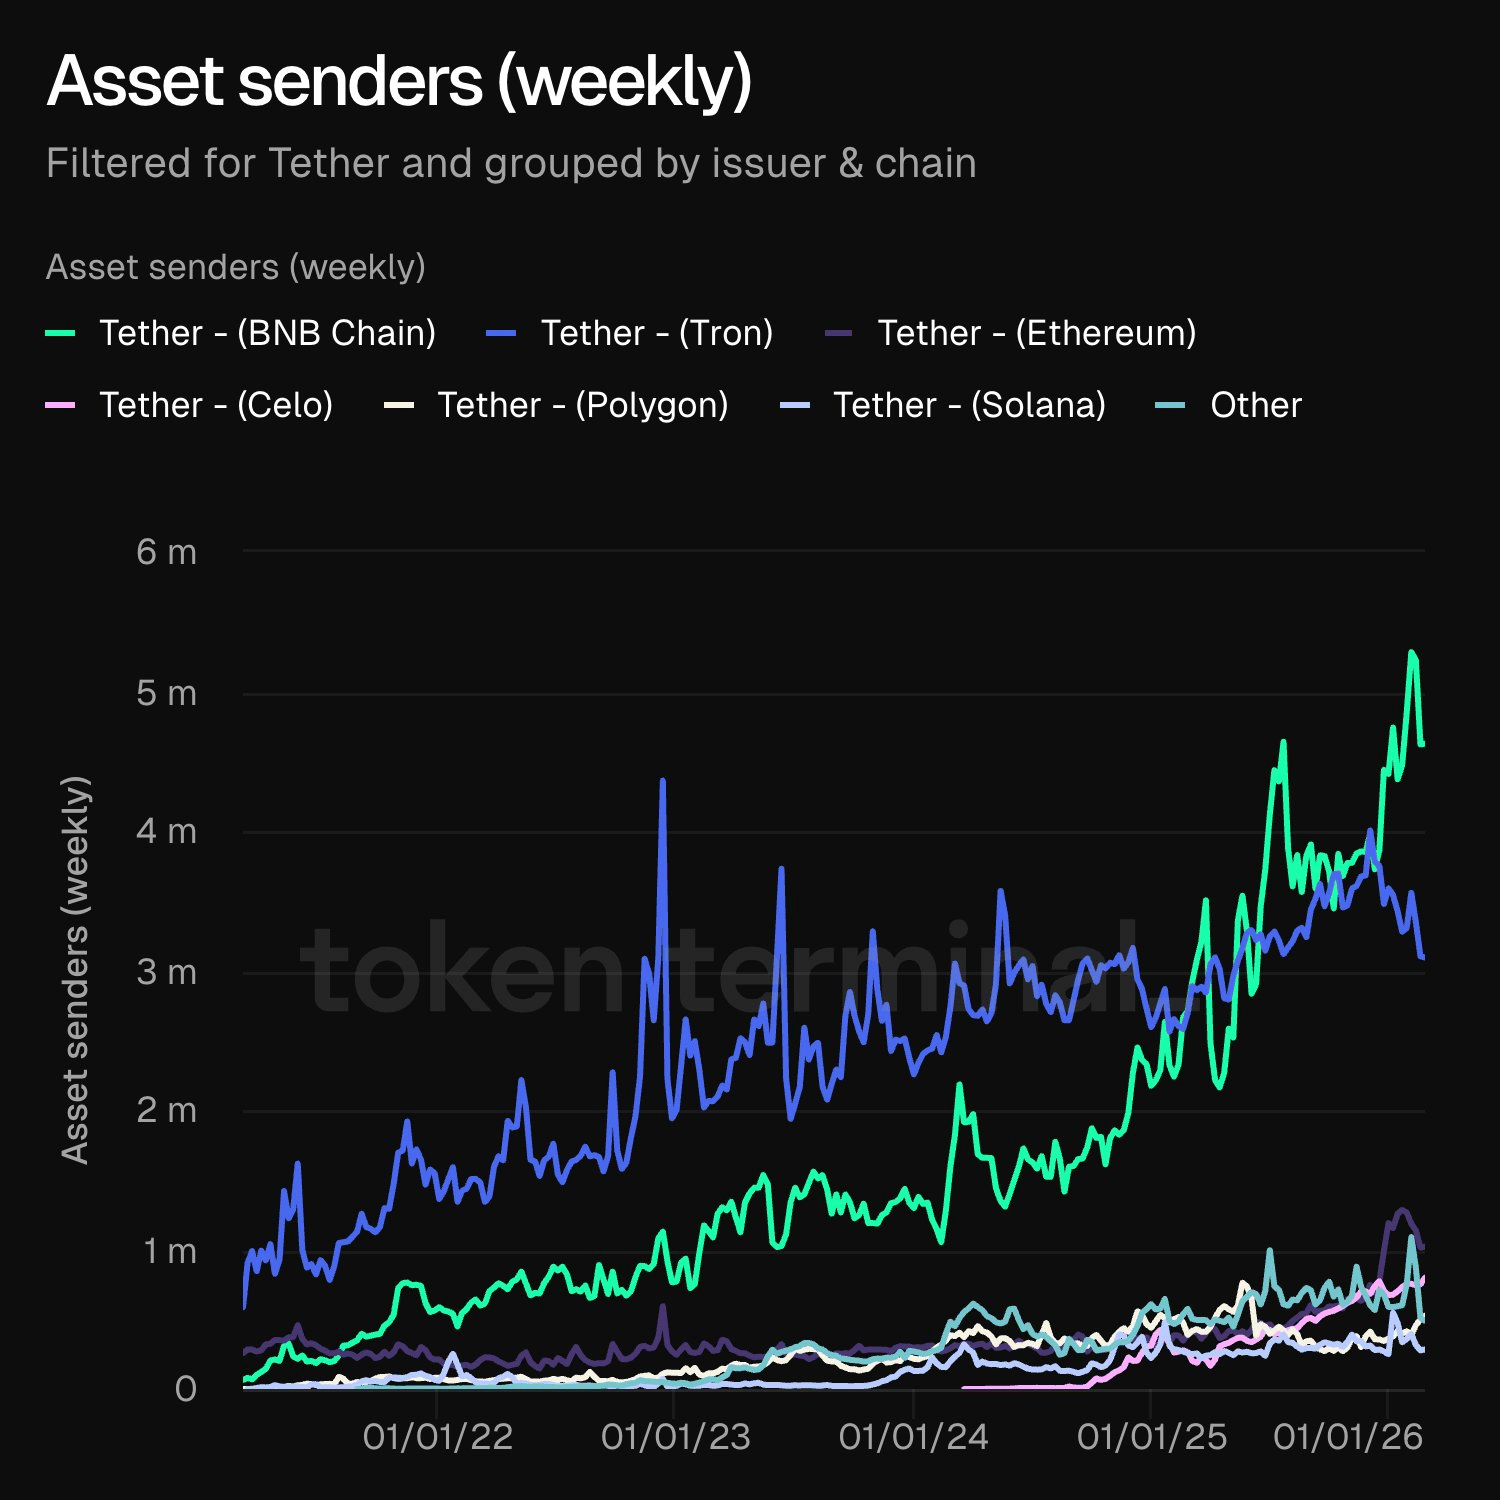
10. Asset senders (weekly). Measures the number of unique addresses that initiated a transfer of the asset in the past 7 days. Smooths out daily noise. Better for week-over-week trend analysis.
11. Asset senders (monthly). Measures the number of unique addresses that initiated a transfer of the asset in the past 30 days. The most stable of the three. Use this for longer-term adoption tracking.