- Token Terminal
- Posts
- Bloomberg x Token Terminal: Onchain Data and Its Role in Investment Analysis
Bloomberg x Token Terminal: Onchain Data and Its Role in Investment Analysis
A write-up of our recent webinar with Bloomberg, covering the onchain data landscape and its application in investment analysis.

This is a write-up of our recent webinar with Bloomberg, covering the onchain data landscape and its application in investment analysis. The webinar was led by Alex Wenham, Digital Asset Product and Strategy Lead at Bloomberg, and Oskari Tempakka, Head of Growth at Token Terminal.
You can tune in to the full webinar on YouTube.
The below transcript has been summarized and edited for clarity.
Breaking down crypto as an asset class
Alex (Bloomberg):
Crypto as an asset class is not homogeneous. Bloomberg prioritizes the top 50 cryptoassets, chosen based on criteria such as custody support, trading volume on reputable venues, market capitalization, and liquidity. From a Token Terminal perspective, how is the distinction made among the thousands of assets available?
Oskari (Token Terminal):
Broadly speaking, we see two layers of crypto applications:
Blockchains: Global, open-source application platforms
Applications: Businesses that run on 1 or more blockchains
Both blockchains and the applications built on top of them are conceptually similar to traditional marketplace companies, that can be valued based on fundamental metrics such as user activity, revenue, and earnings.
We showcase that cryptoassets are not merely speculative, but rather productive assets that should be valued based on the cash-flows they produce.
This is what we focus on: fundamentally sound, internet-native companies.
In terms of how we identify these fundamentally sound protocols and businesses to list on Token Terminal, we follow two frameworks:
We evaluate current economic traction and user network effects
We predict which ecosystems will thrive in the mid to long-term
Our goal is to feature data for all promising, innovative, well-funded, and fundamentally sound projects on our platform for investors to assess.
Creating standardized financial metrics for cryptoassets
Alex (Bloomberg):
When we surveyed our clients about what they sought from Bloomberg in regards to crypto, there was asset coverage, pricing, other metrics, and then this broad term of "onchain data", which was requested by 85% of our clients. However, the term "onchain data" meant different things to different clients.
So, at Bloomberg, we've approached this through a tiered approach:
At the base of onchain data, you find raw, unadulterated data that comes directly from the blockchain.
Moving up, you get to wallet based information. This includes flows to exchanges, whale flows, etc.
At the peak, raw data and wallet activities are combined to derive data-driven insights, where analytical firms like Token Terminal excel.
Given the diversity within crypto assets and their use cases, how does Token Terminal segment this nascent asset class and adapt metrics for different crypto assets according to their specific use cases?
Oskari (Token Terminal):
Our method involves categorizing projects by market sector. We currently feature 16 market sectors on Token Terminal, ranging from Blockchains (L1) to Exchanges (DEX), Stablecoin issuers, Gaming, Social media, and Asset management, among others. This categorization allows for precise benchmarking and comparison.

The are a total of 16 Market sector dashboards available on Token Terminal.
To ensure comparability, we take a very standardized approach to decoding the business logic of smart contracts to translate individual transactions into financial metrics. This approach positions us as the accounting layer of the crypto market.
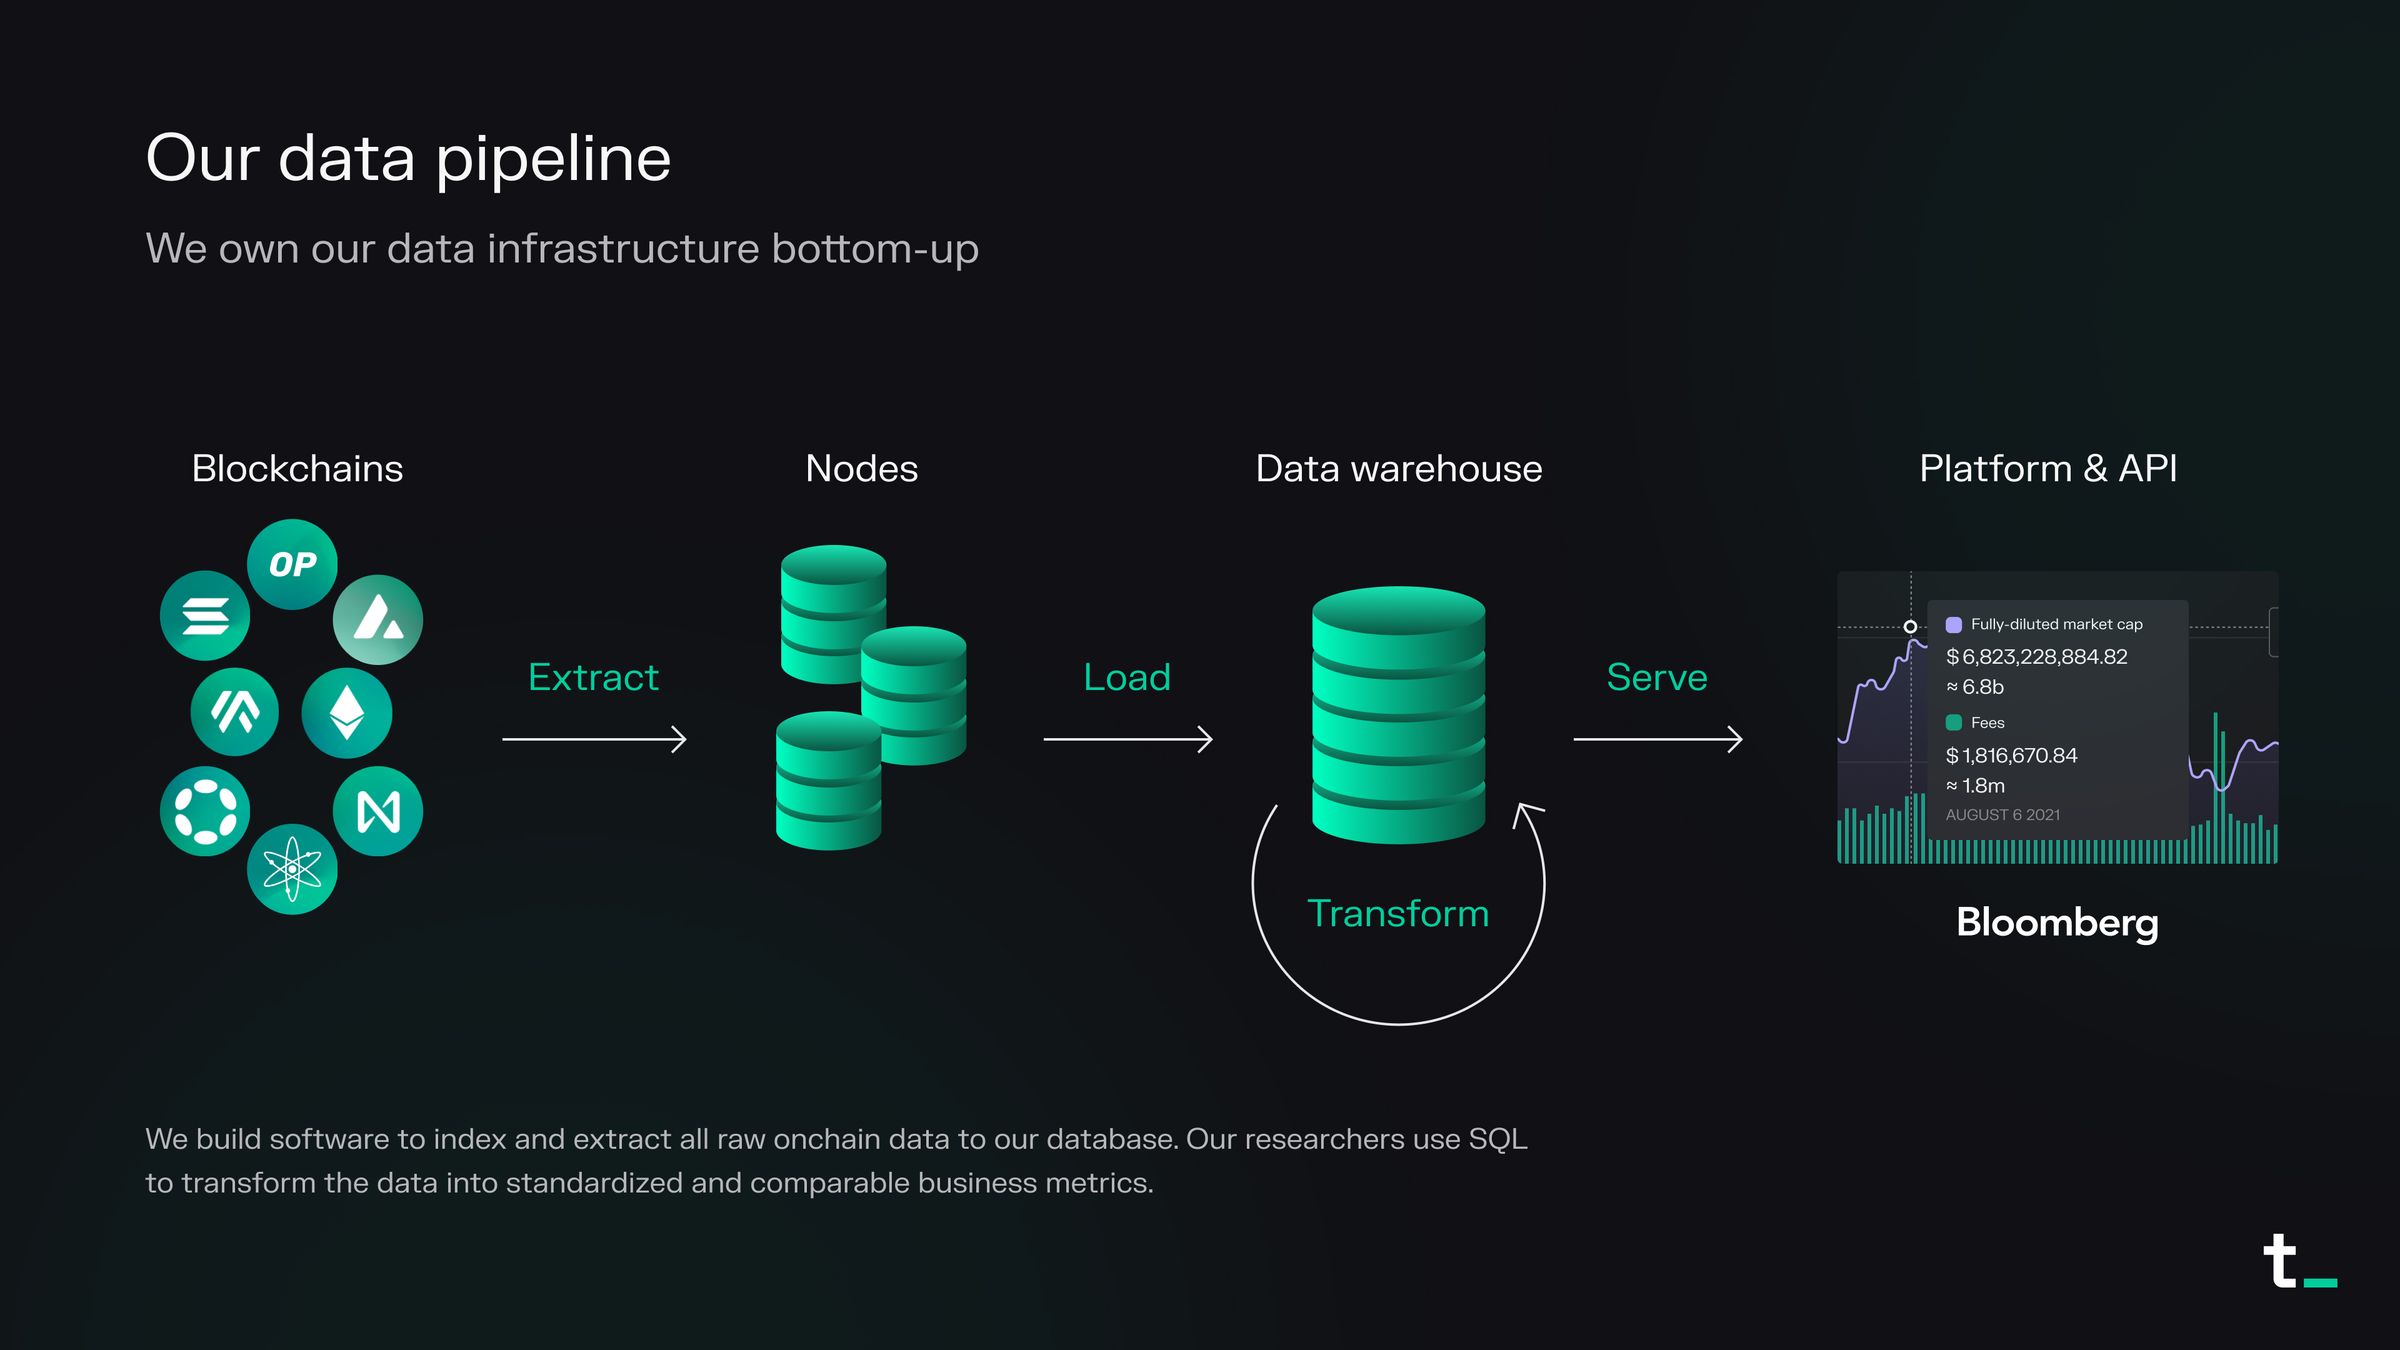
We ensure the best possible data quality, granularity, and accuracy through our vertically integrated data supply chain.
We think of crypto through two primary layers: blockchains and the applications built on top of them:
Blockchains are networks, or application platforms, with metric coverage inspired by AWS/Google Cloud-type businesses.
Applications are companies, with their metric coverage reflecting the relevant market sector they operate in, modeling what you’d see in traditional equity analysis.
The real-time nature of blockchain data introduces a new level of detail and timeliness in financial reporting, moving far beyond traditional quarterly earnings frameworks.
We’re now able to deliver “Earnings call” style data at any desired frequency (daily, weekly, monthly, etc.), showcasing the dynamic nature of these internet-native companies.
This marks a fundamental shift in the precision and depth of stakeholder reporting, something we've never seen before.

Ethereum's financial statement (weekly granularity).
To create standardized metrics for projects, we begin by identifying the revenue generating activity, applicable to both blockchains and applications. Revenue-generating activity is equivalent to gross merchandise value (GMV), or volume.
Next, we map out the stakeholders involved, and track who pays fees, the reasons behind these payments, and the recipients of these fees.
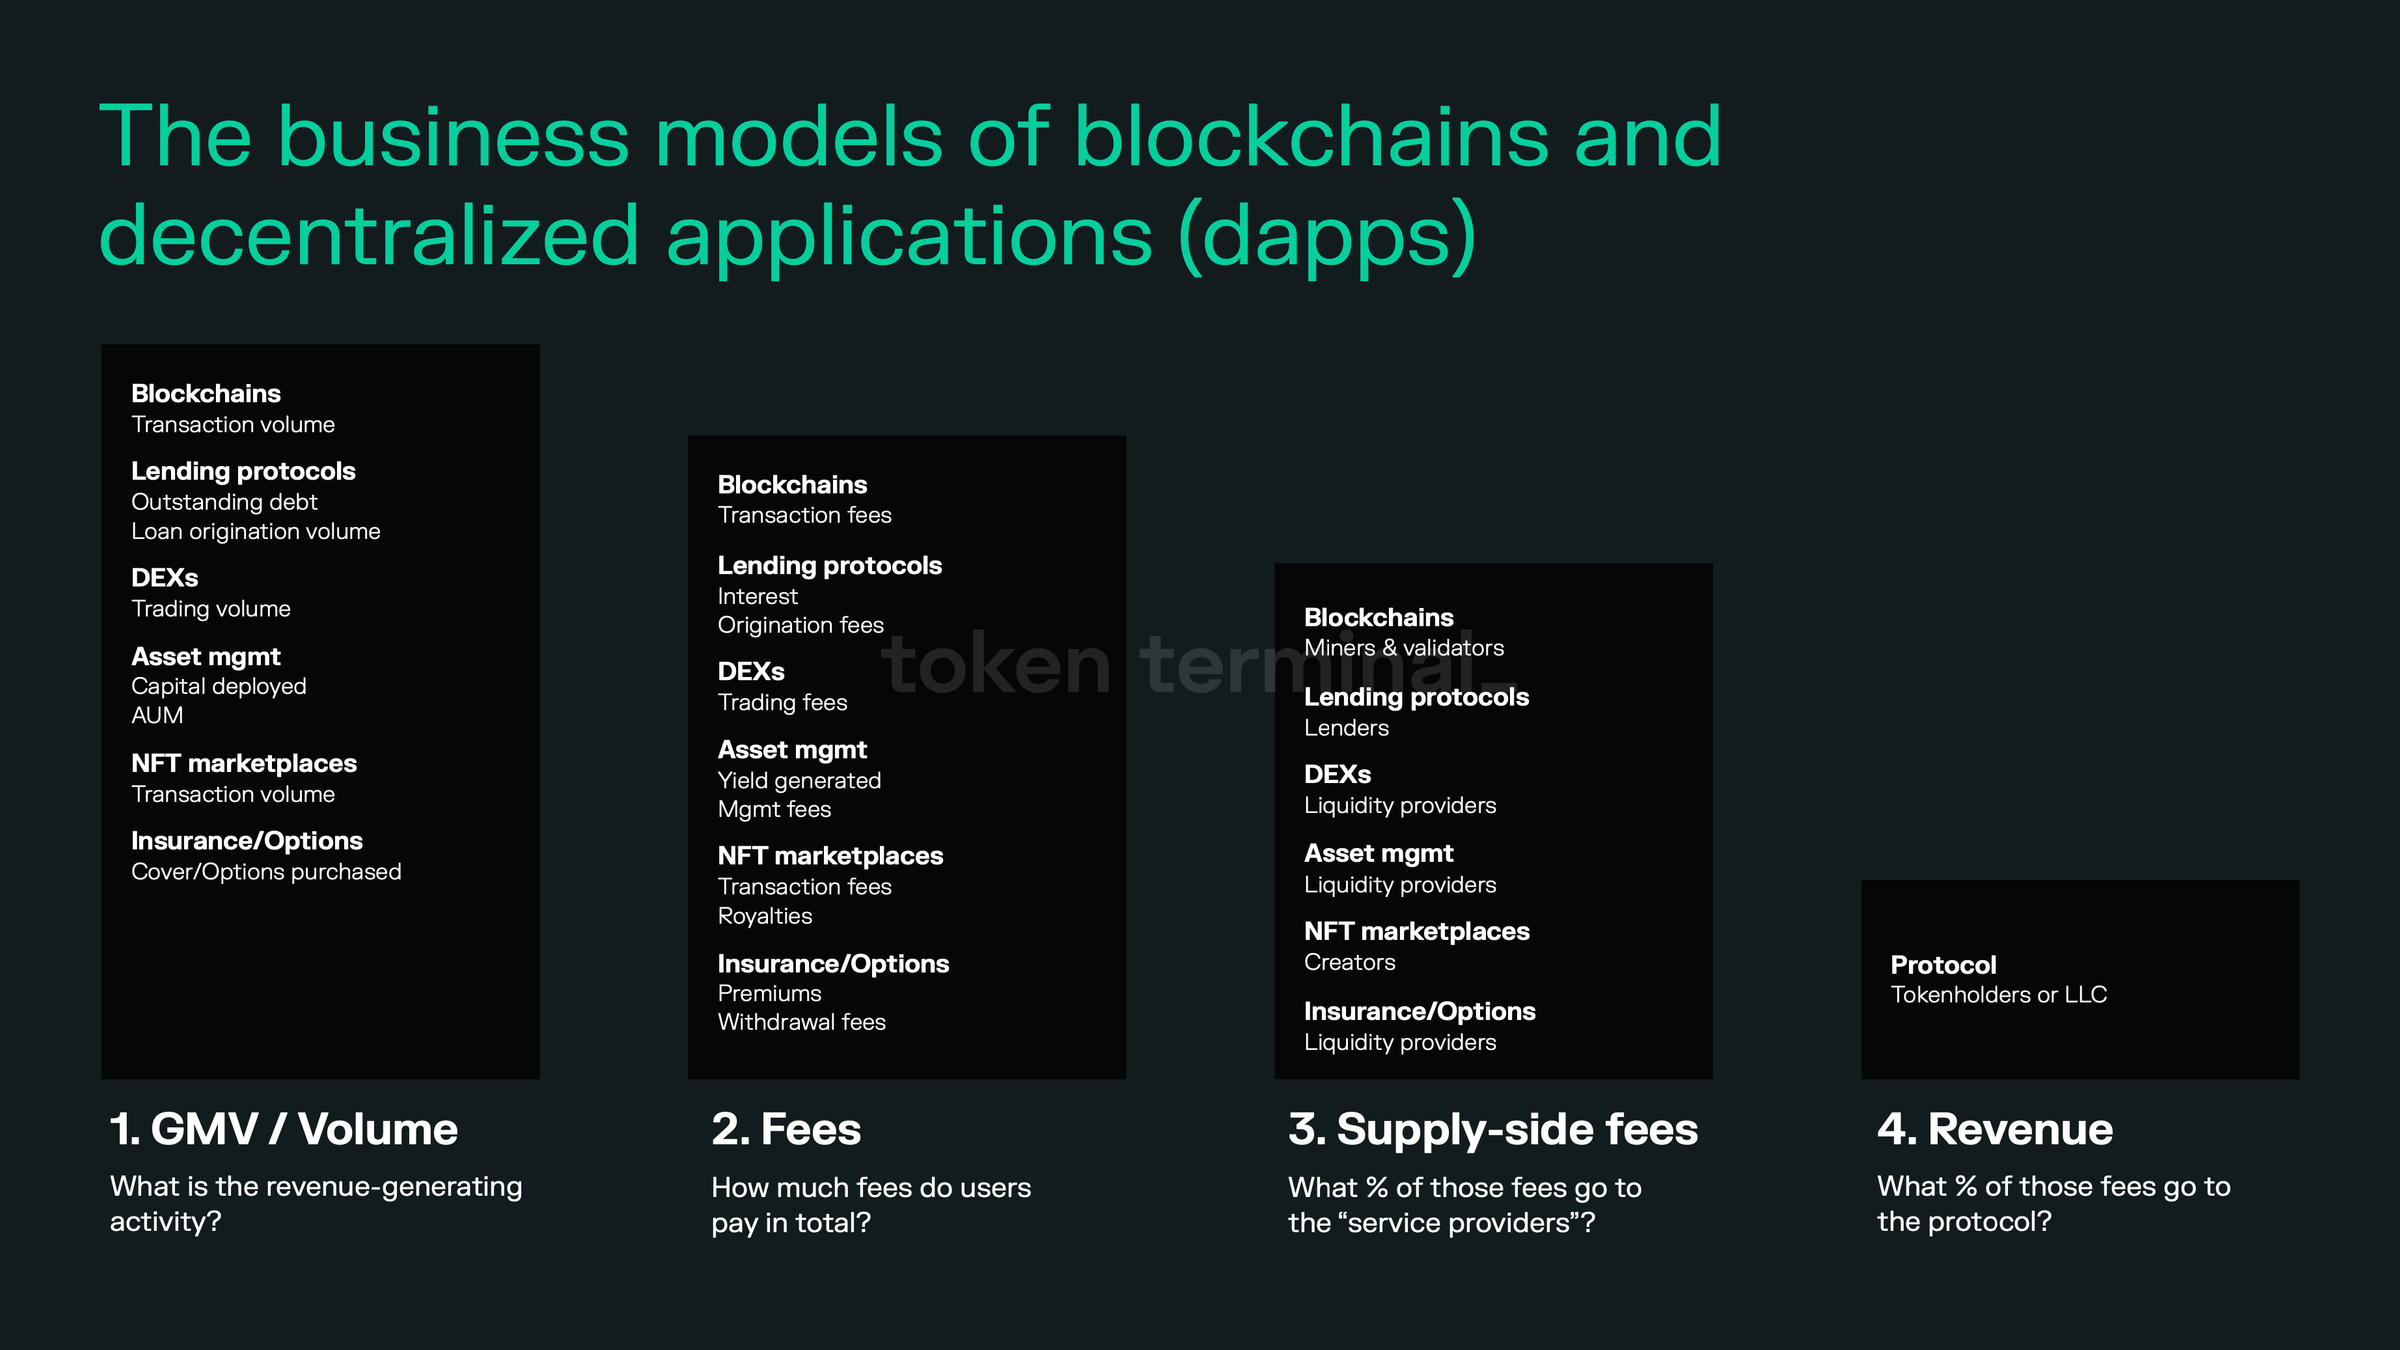
Case example: Ethereum
Revenue-generating activity: Total transaction volume on the blockchain.
Fees: Transaction fees paid by users.
Supply-side fees: Validators' share of transaction fees.
Revenue: Share of transaction fees that are burned.
In Ethereum's model, a part of every transaction fee is permanently eliminated from circulation (burned), akin to a stock buyback. This reduction acts as revenue for Ethereum, as it creates value for ETH tokenholders by reducing supply.
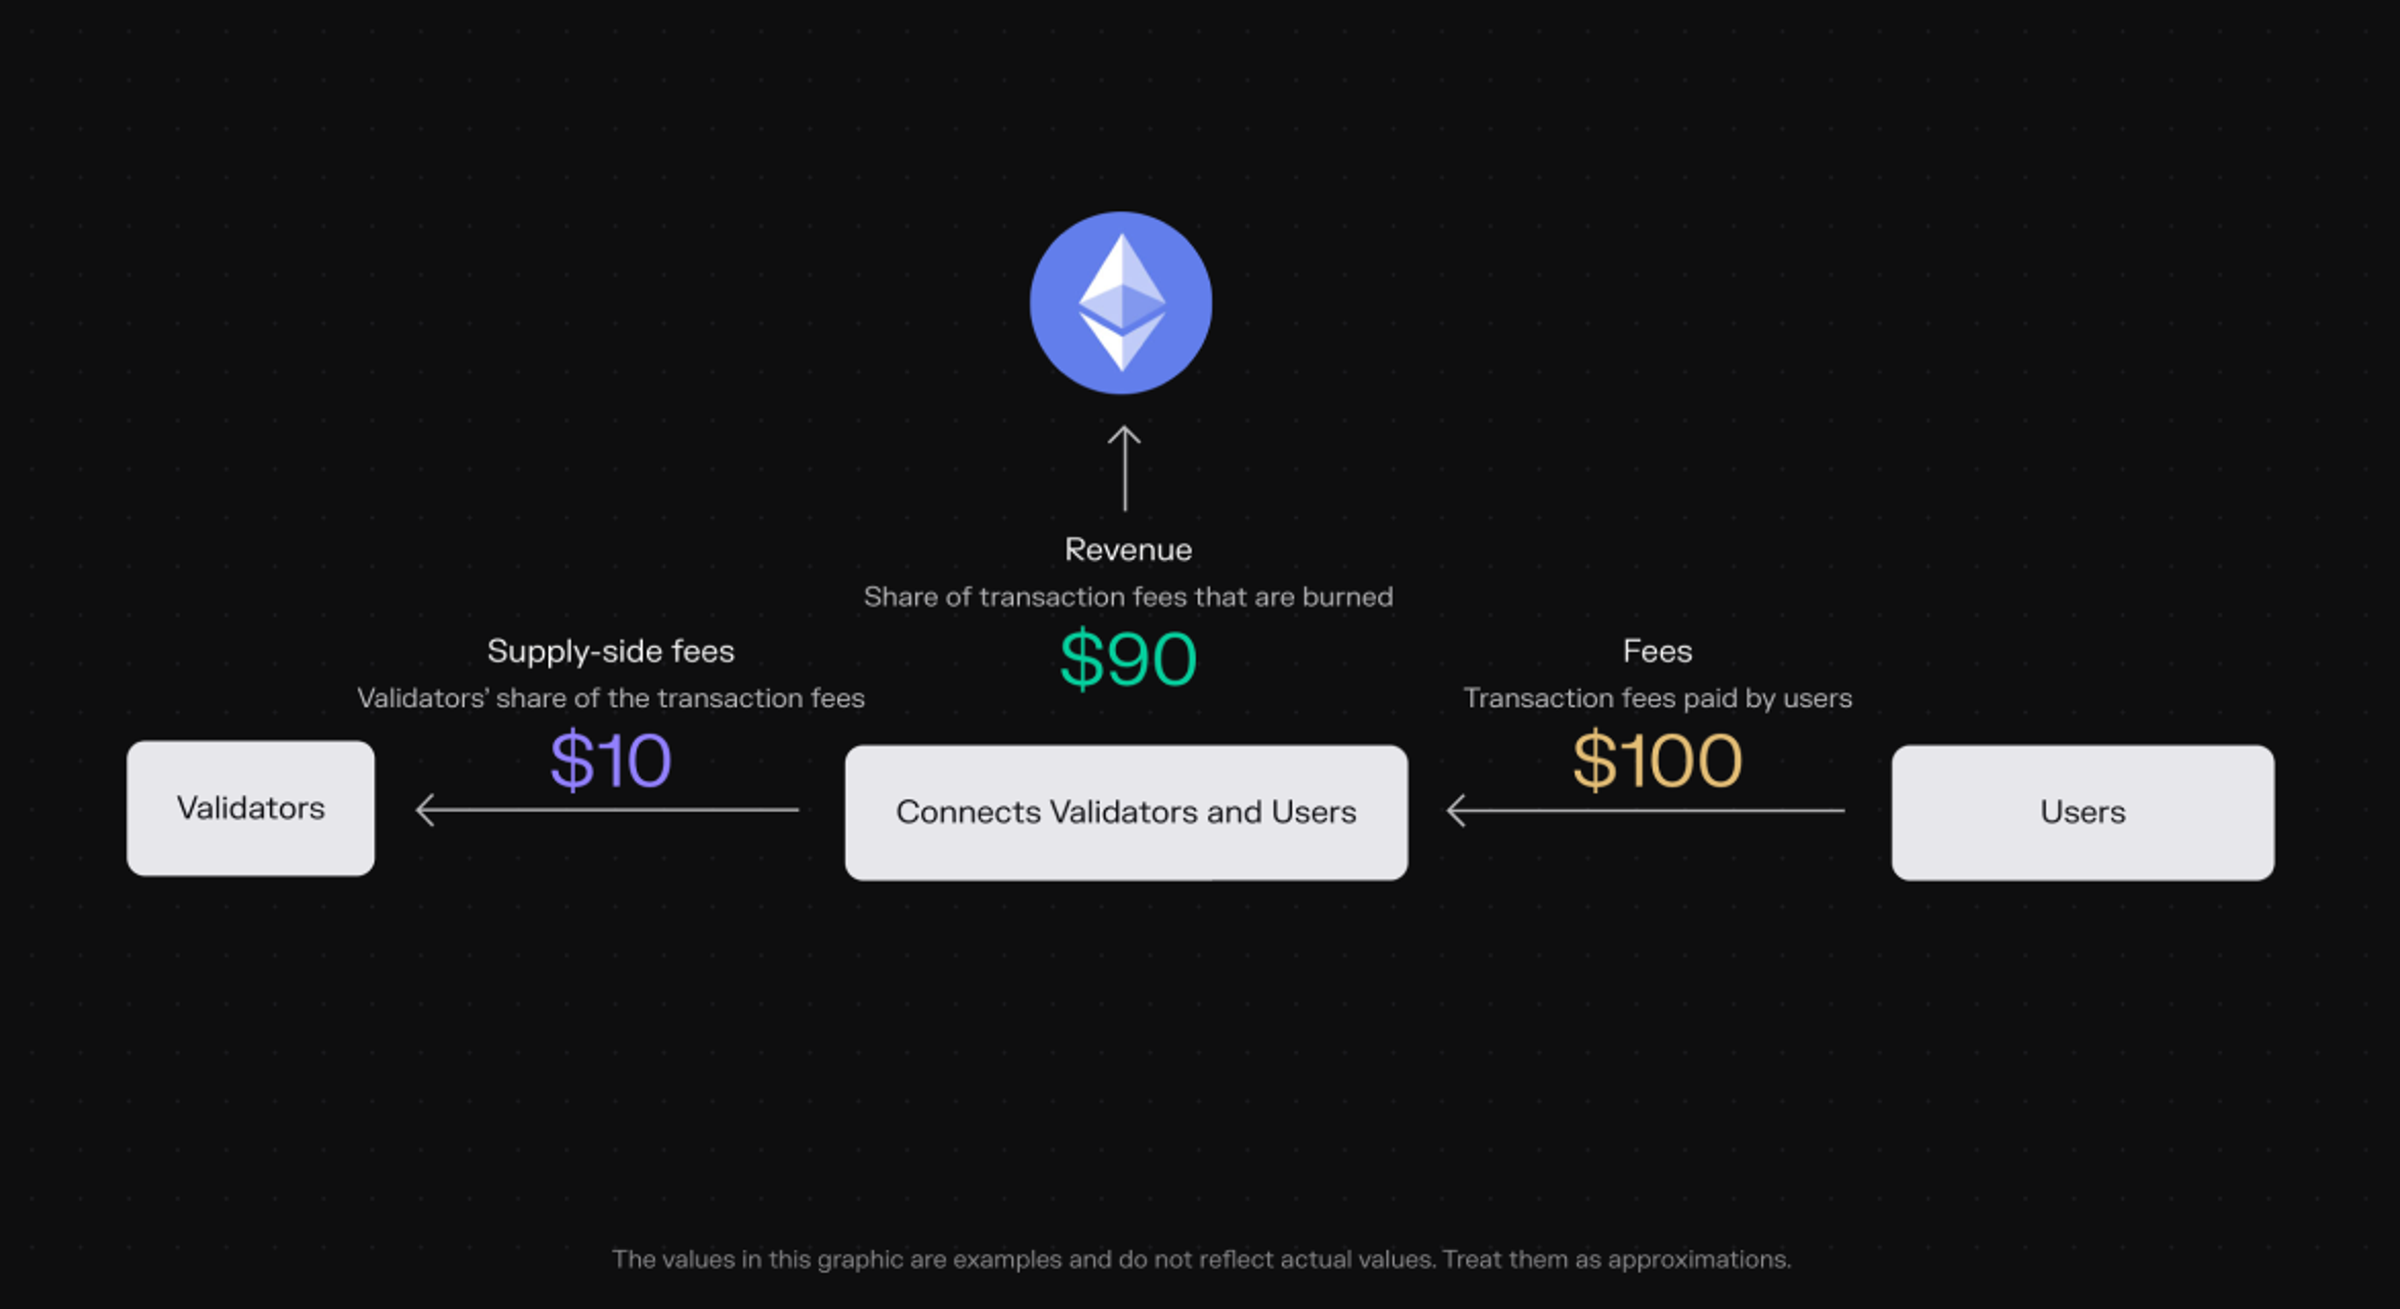
Ethereum's business model.
Case example: Compound
Compound is an onchain bank, that connects lenders and borrowers.
Revenue-generating activity: Outstanding loans.
Fees: Interest payments on the loans.
Supply-side fees: Lenders’ share of the interest payments.
Revenue: Compound’s share of the interest payments.

Compound's business model.
The decision lies with investors or analysts to determine which metrics are most relevant for evaluating a specific project, factoring in its purpose, maturity, adoption level, etc.
The above examples showcase how we derive the basic metrics for analyzing a project’s business model and financial performance.
As of today, Token Terminal offers 46 metrics, including both financial and alternative data points, with Daily Active Users (DAU), Core developers, Token Incentives, Cost of revenue, and valuation multiples like Price to Fees (P/F) and Price to Sales (P/S) ratios being some of the most popular KPIs that investors track.
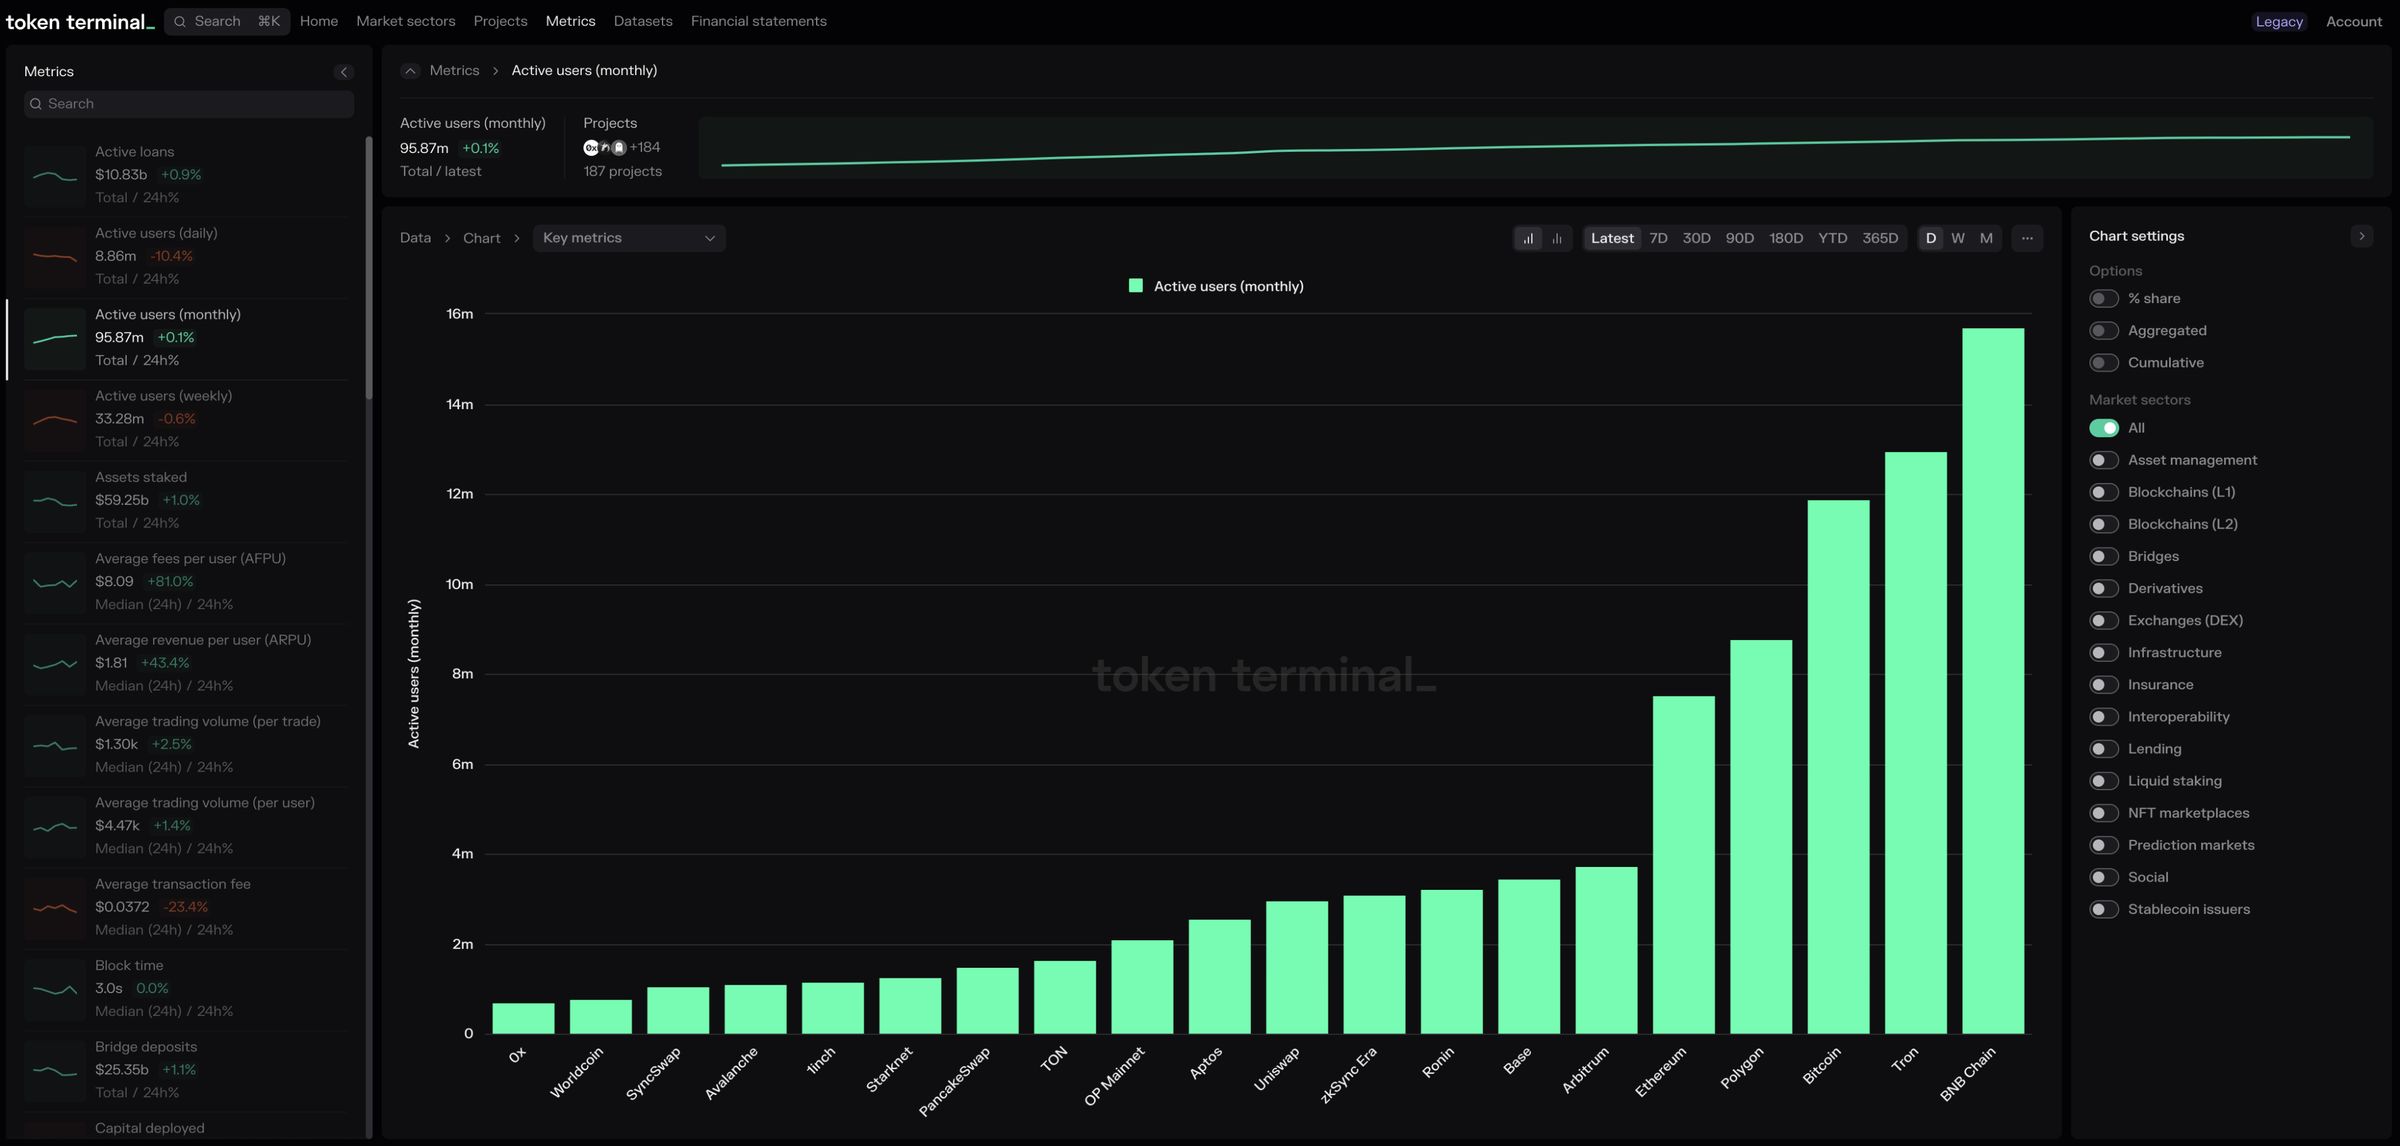
Investors can analyze blockchains and decentralized applications via 46 different financial and alternative metrics.
The importance of qualitative context to accompany onchain data
Alex (Bloomberg):
Decentralized autonomous organizations (DAOs) represent a revolutionary model of decentralized governance, but the benefits of holding a DAOs token can differ significantly from one organization to another. For instance, Uniswap's consideration on potentially sharing revenue with tokenholders adds a layer of complexity to the token's valuation. How should investors be thinking about this variance in DAO structures and monetization?
Oskari (Token Terminal):
While quantitative data provides a solid foundation for understanding a DAO's financial health, qualitative factors are just as crucial. A protocol like Uniswap might not currently distribute revenue to tokenholders, which, if viewed in isolation, could mislead investors about its value proposition in comparison to applications like MakerDAO or Compound, where the "fee switch" is already turned on.
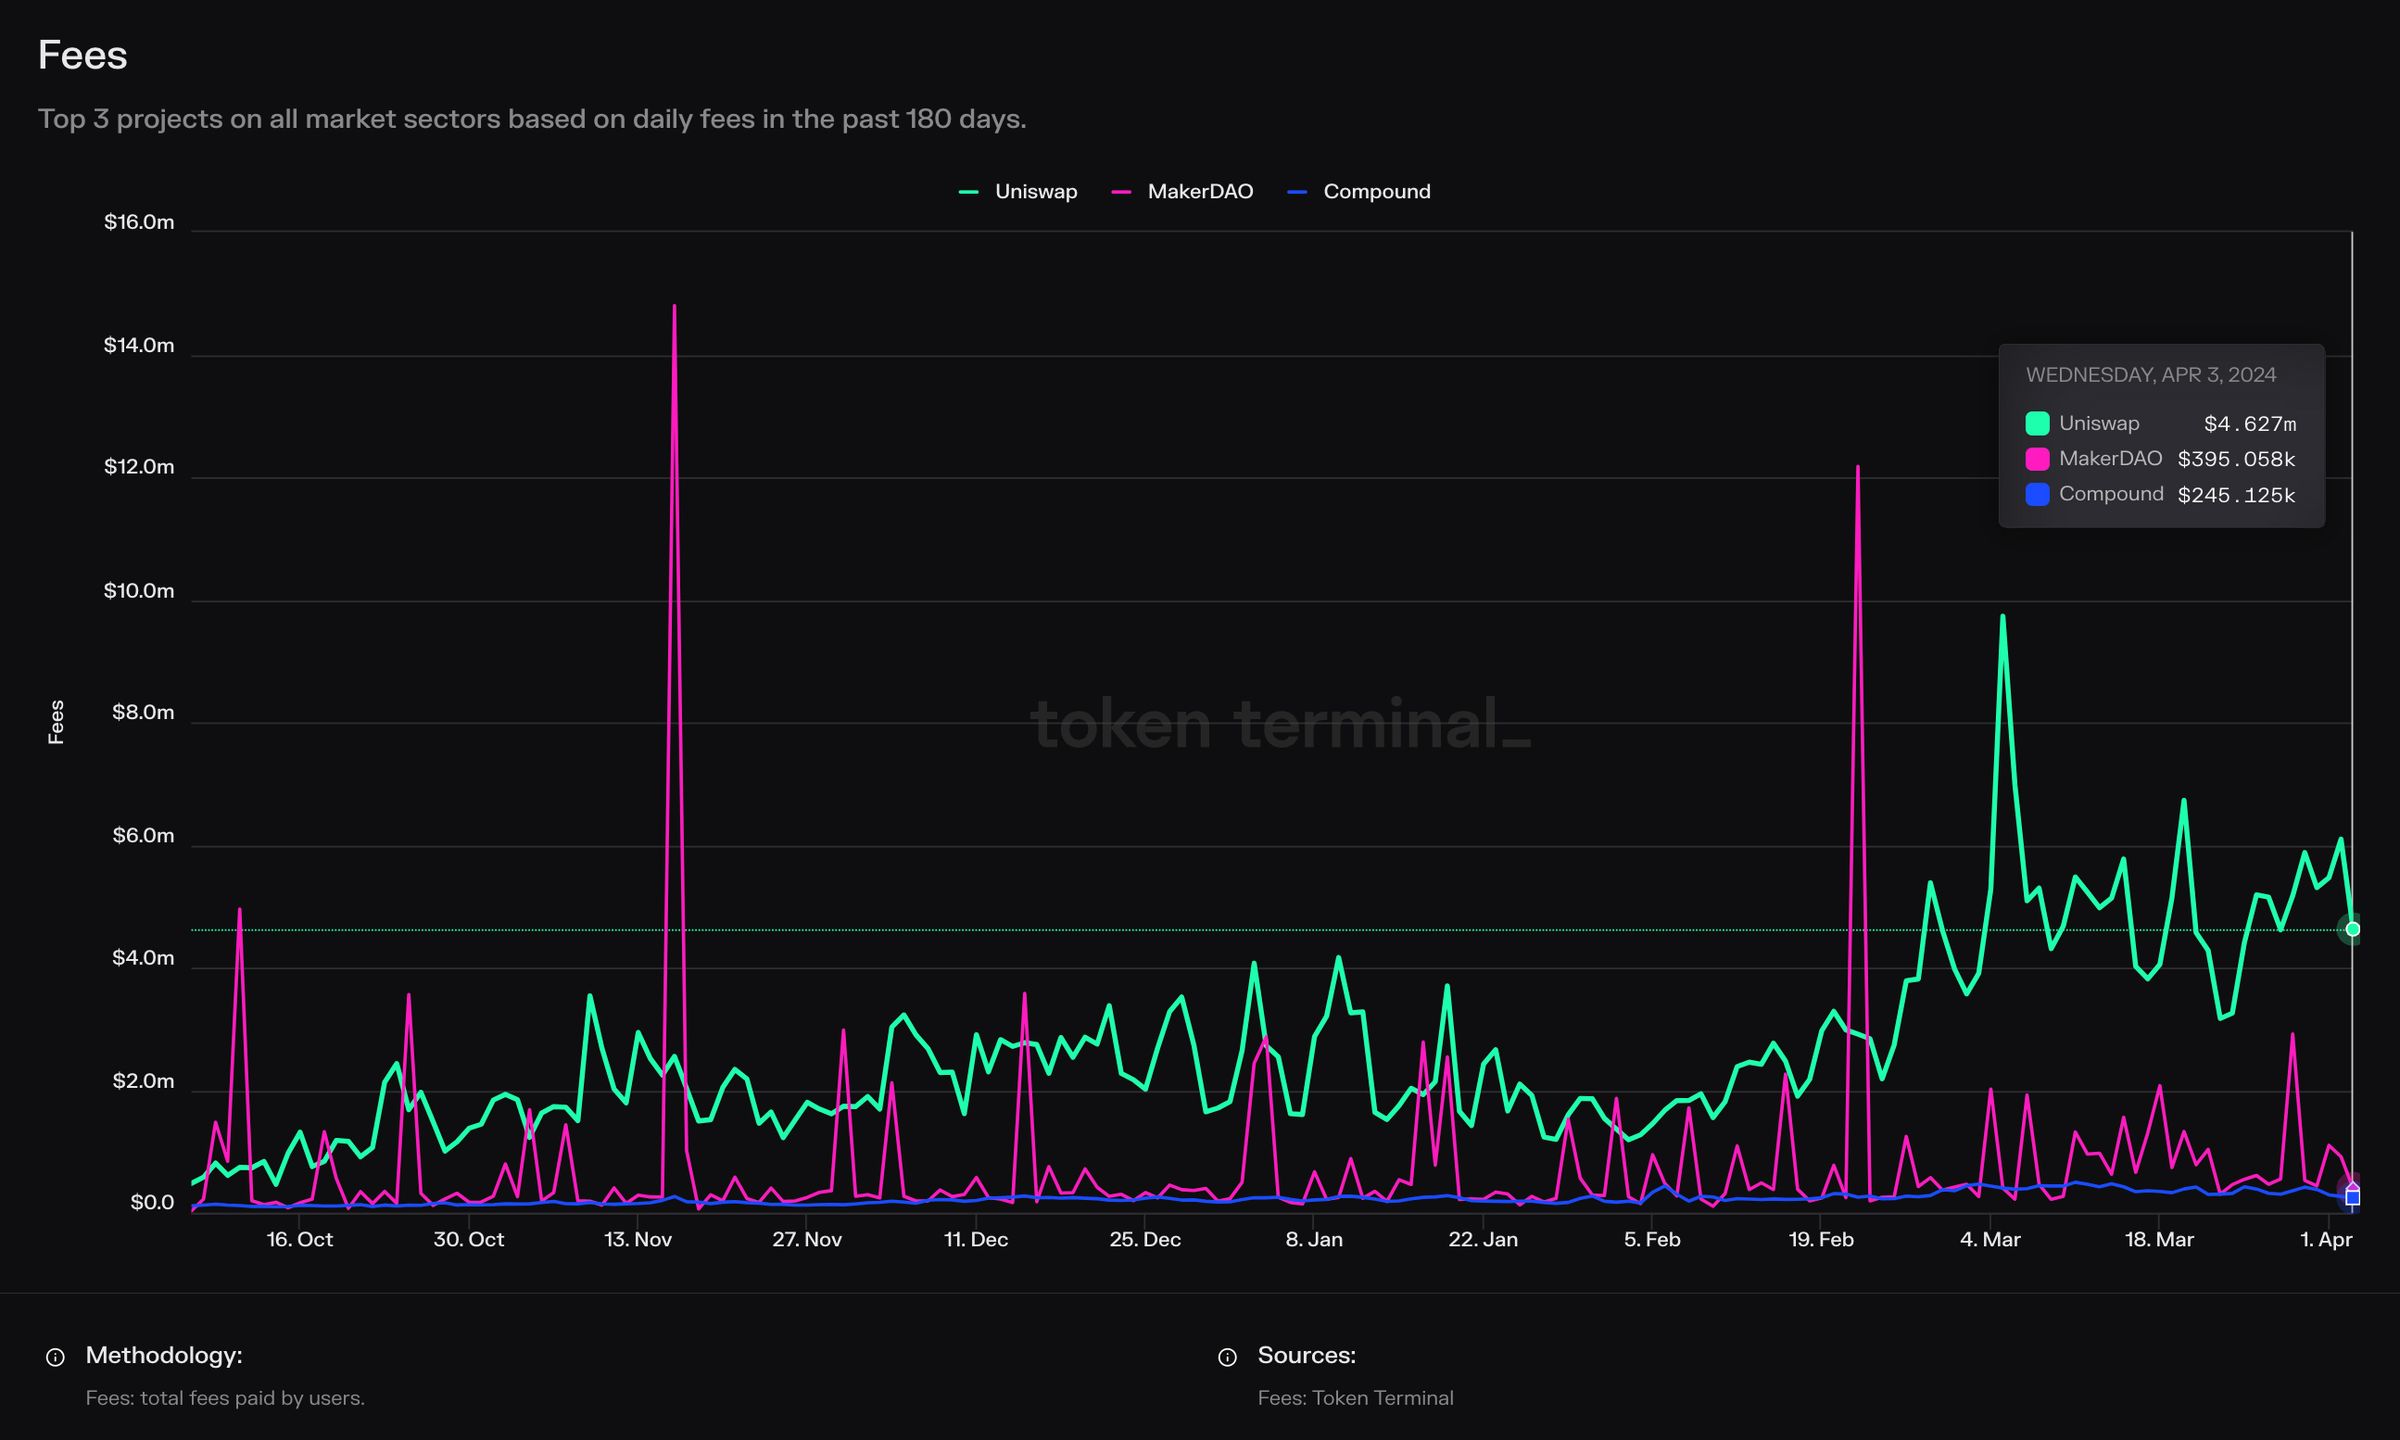
Daily Fees for Uniswap, MakerDAO, and Compound over the past 180 days.
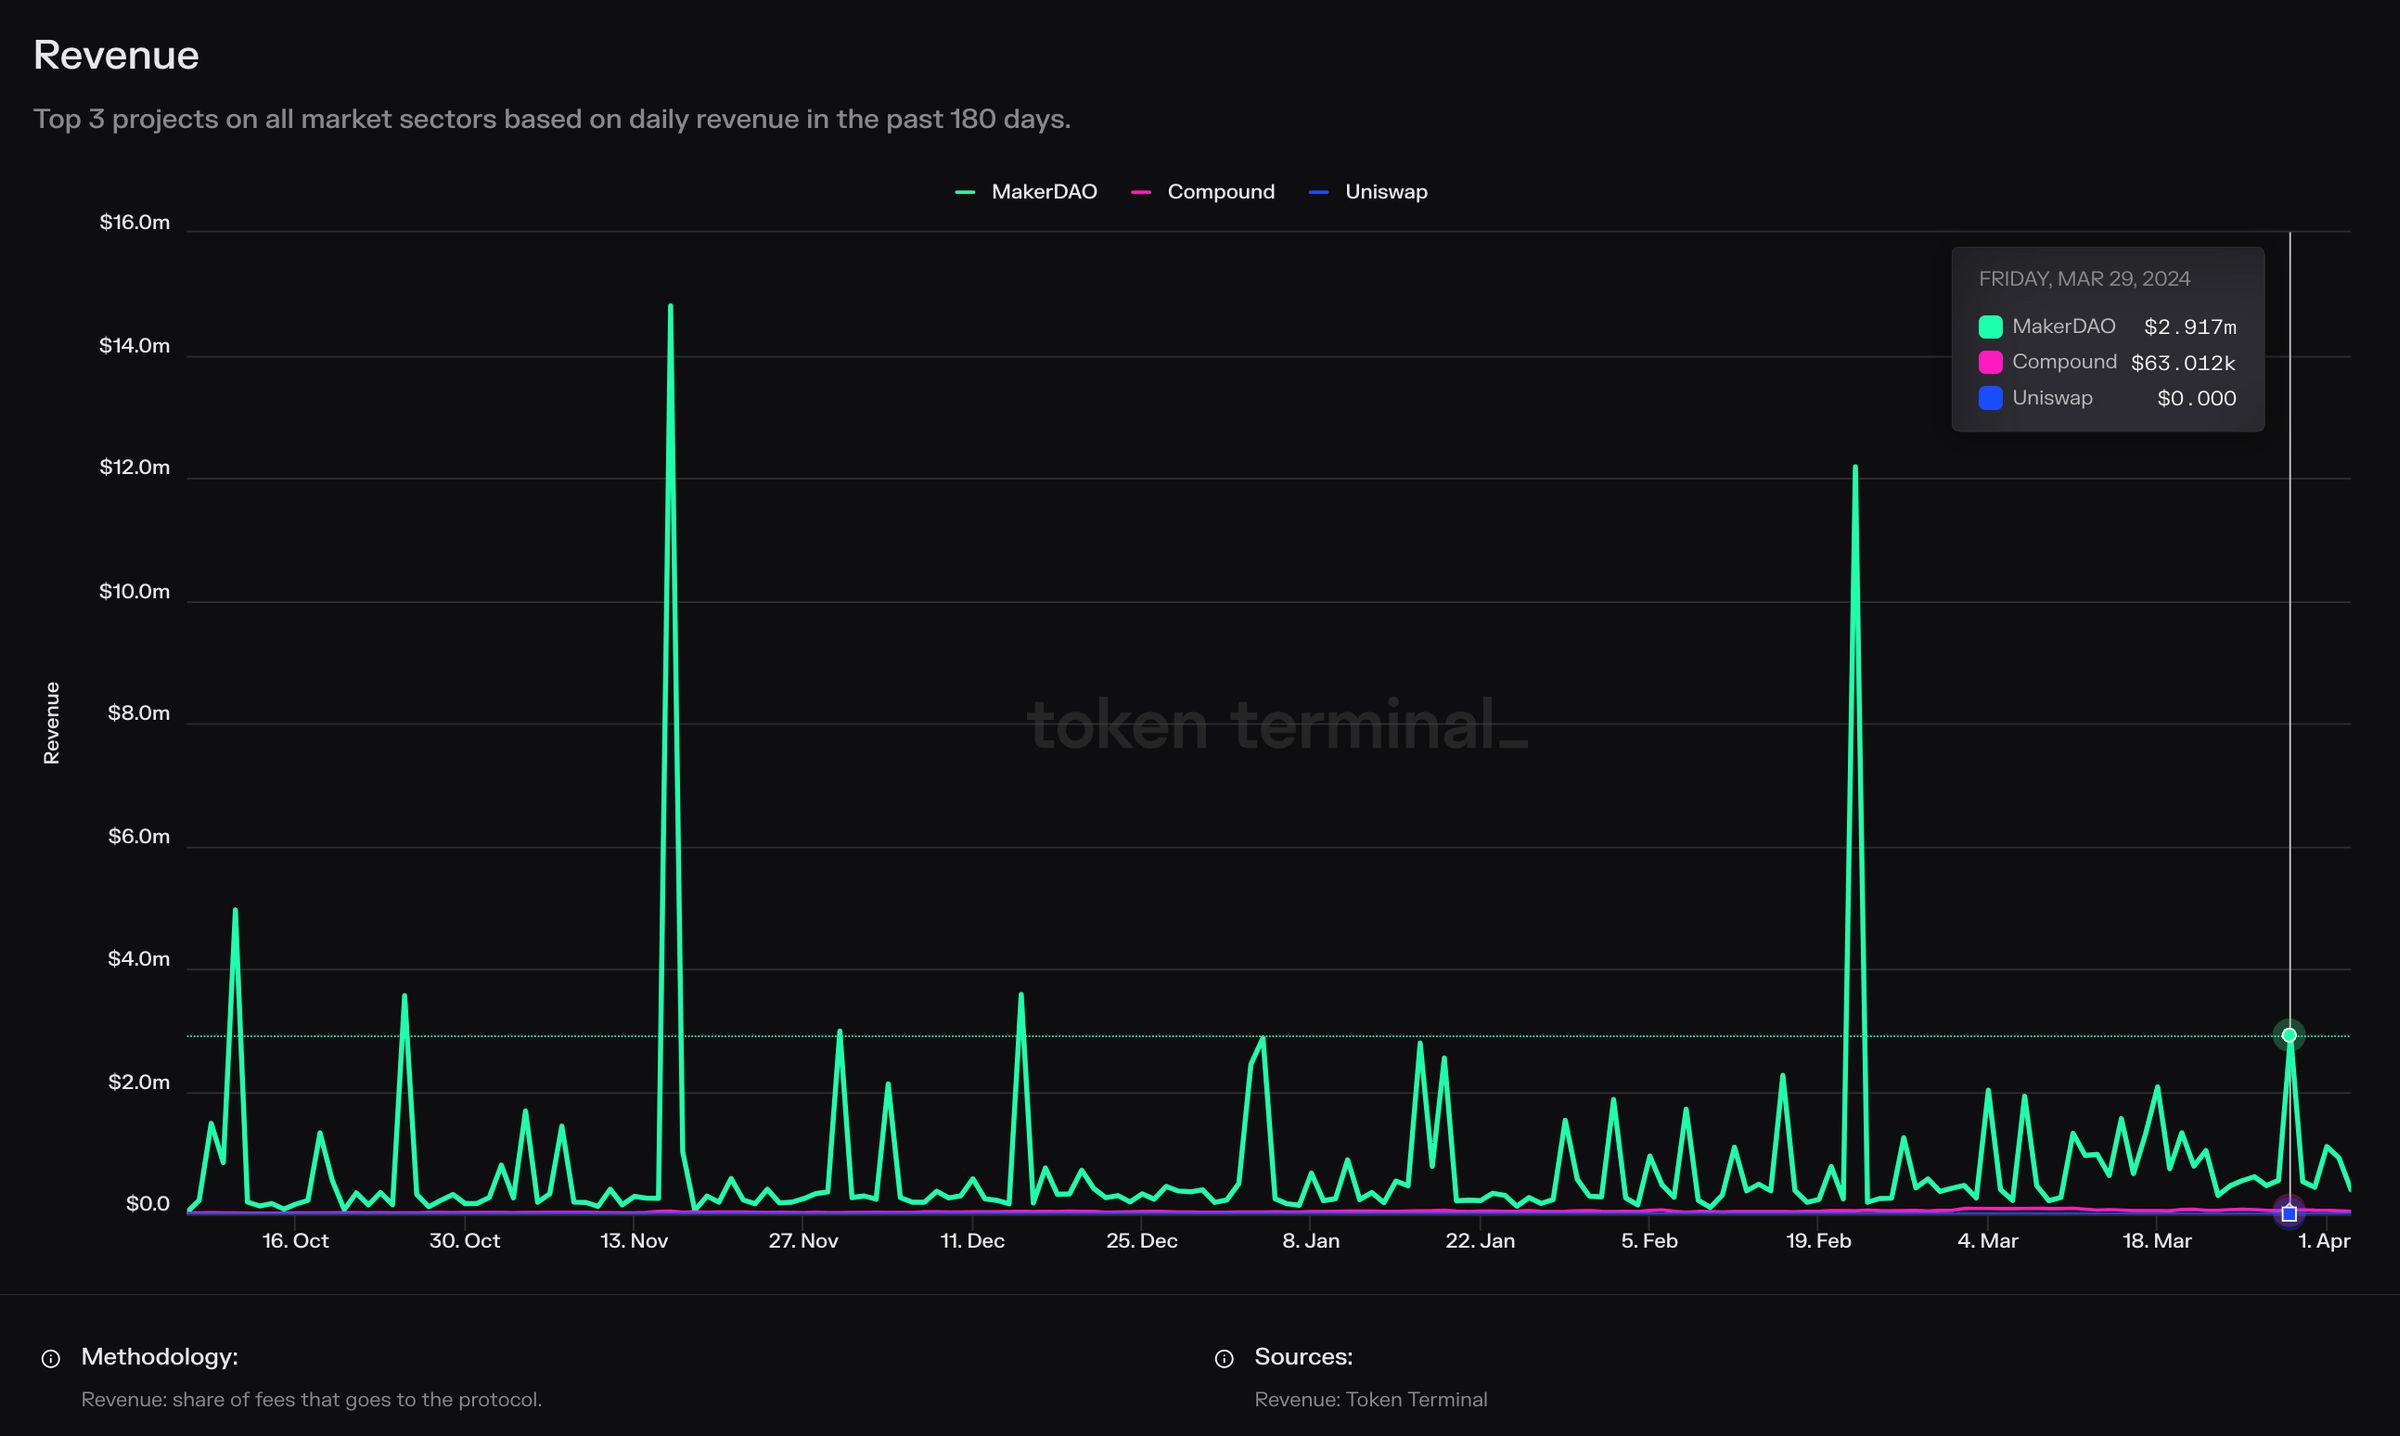
Daily Revenue for Uniswap, MakerDAO, and Compound over the past 180 days.
In the case of assessing Uniswap's potential revenue, you could apply a market standard take rate from other protocols in the Exchange (DEX) market sector, and use that as an assumption in any models for Uniswap.
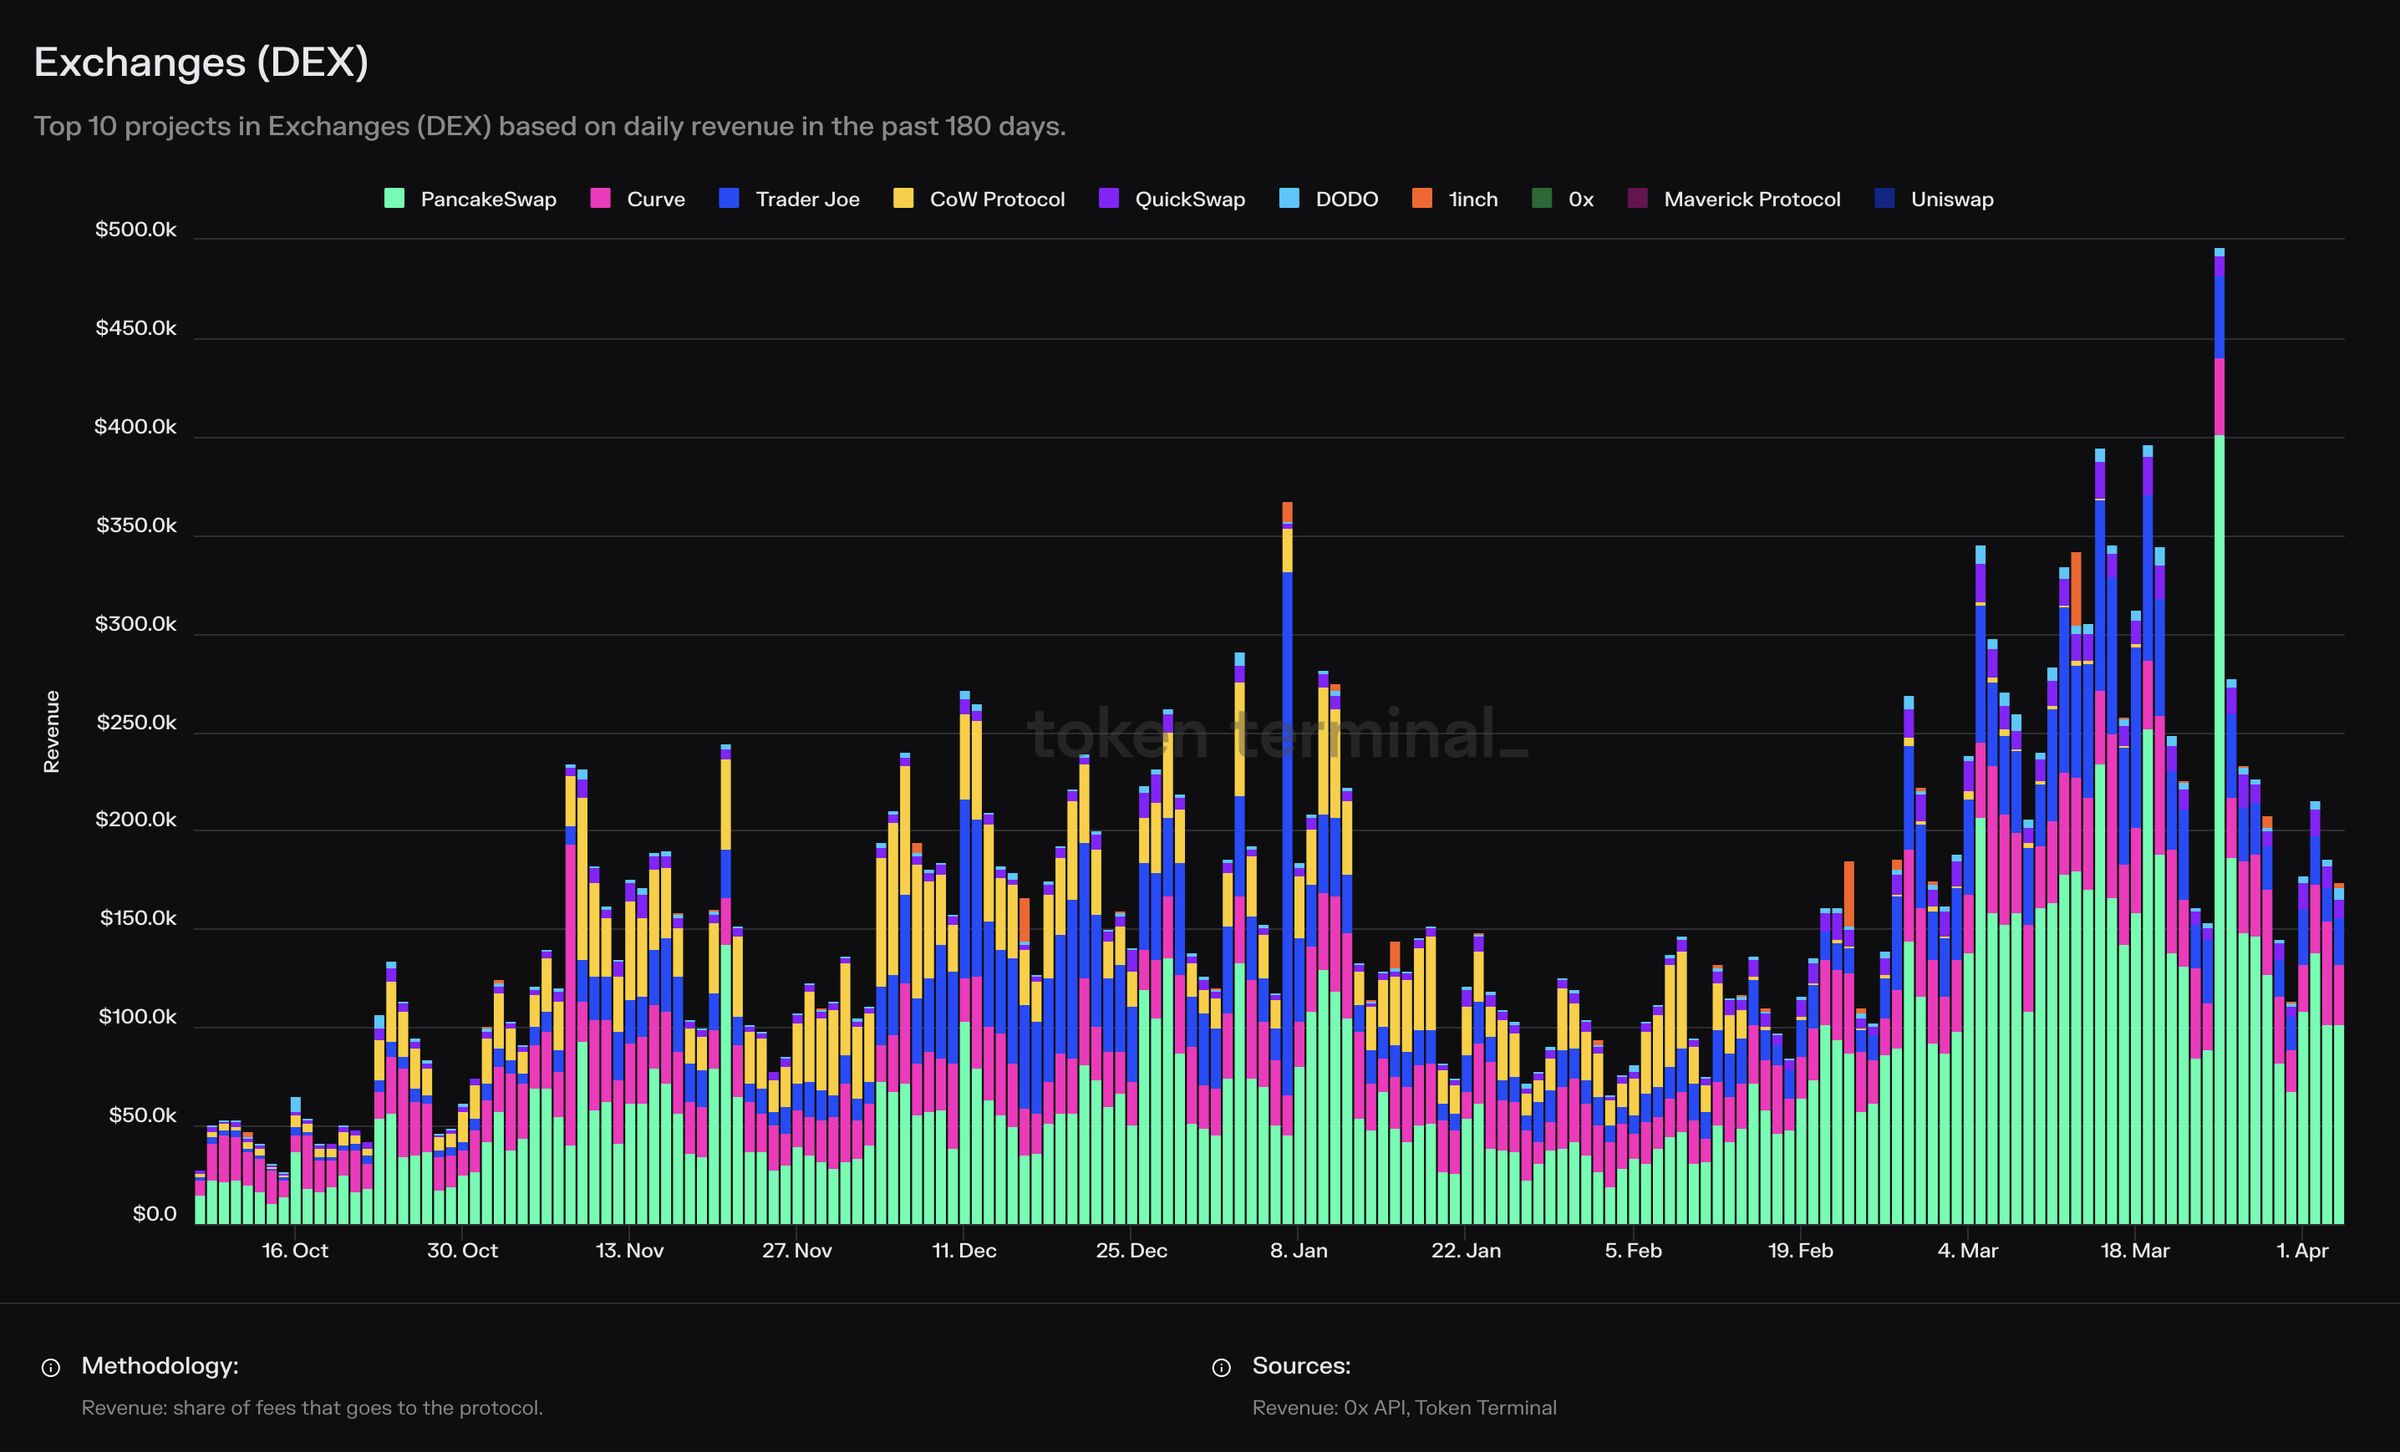
Top 10 projects in Exchanges (DEX) based on daily revenue in the past 180 days.
Analyzing Layer 1 blockchains beyond the surface
Alex (Bloomberg):
At its core, a blockchain operates with a simple business model: it generates revenue through activities like issuing block space. This revenue must then cover the costs paid to validators who secure and maintain the blockchain. However, the intricacies of this model vary significantly across different blockchains, influenced by factors such as transaction fees and network capacity.
While Ethereum has long been a dominant force, its high transaction fees and network congestion have led to the rise of competitors like Solana, known for its technological advancements and lower costs. But comparing Solana to Ethereum directly might not provide a fair assessment due to their different stages of development and technological approaches.
How would you compare something like Solana, to another layer one blockchain, and go a bit deeper into the analysis that you would do to compare those two outside of just the high-level metrics you've described?
Oskari (Token Terminal):
Because blockchains are application development platforms, the goal is to get entrepreneurs to deploy smart contracts – so incorporate businesses – onto these platforms. To do more granular analysis between blockchains, what you want to do to get a better picture of the state of a network is understand what businesses are being launched on these platforms and how these businesses are gaining traction.
To do this, you can view the trending business contracts on a specific blockchain, and do comparative analysis between, for example, the top projects on Solana and Ethereum.
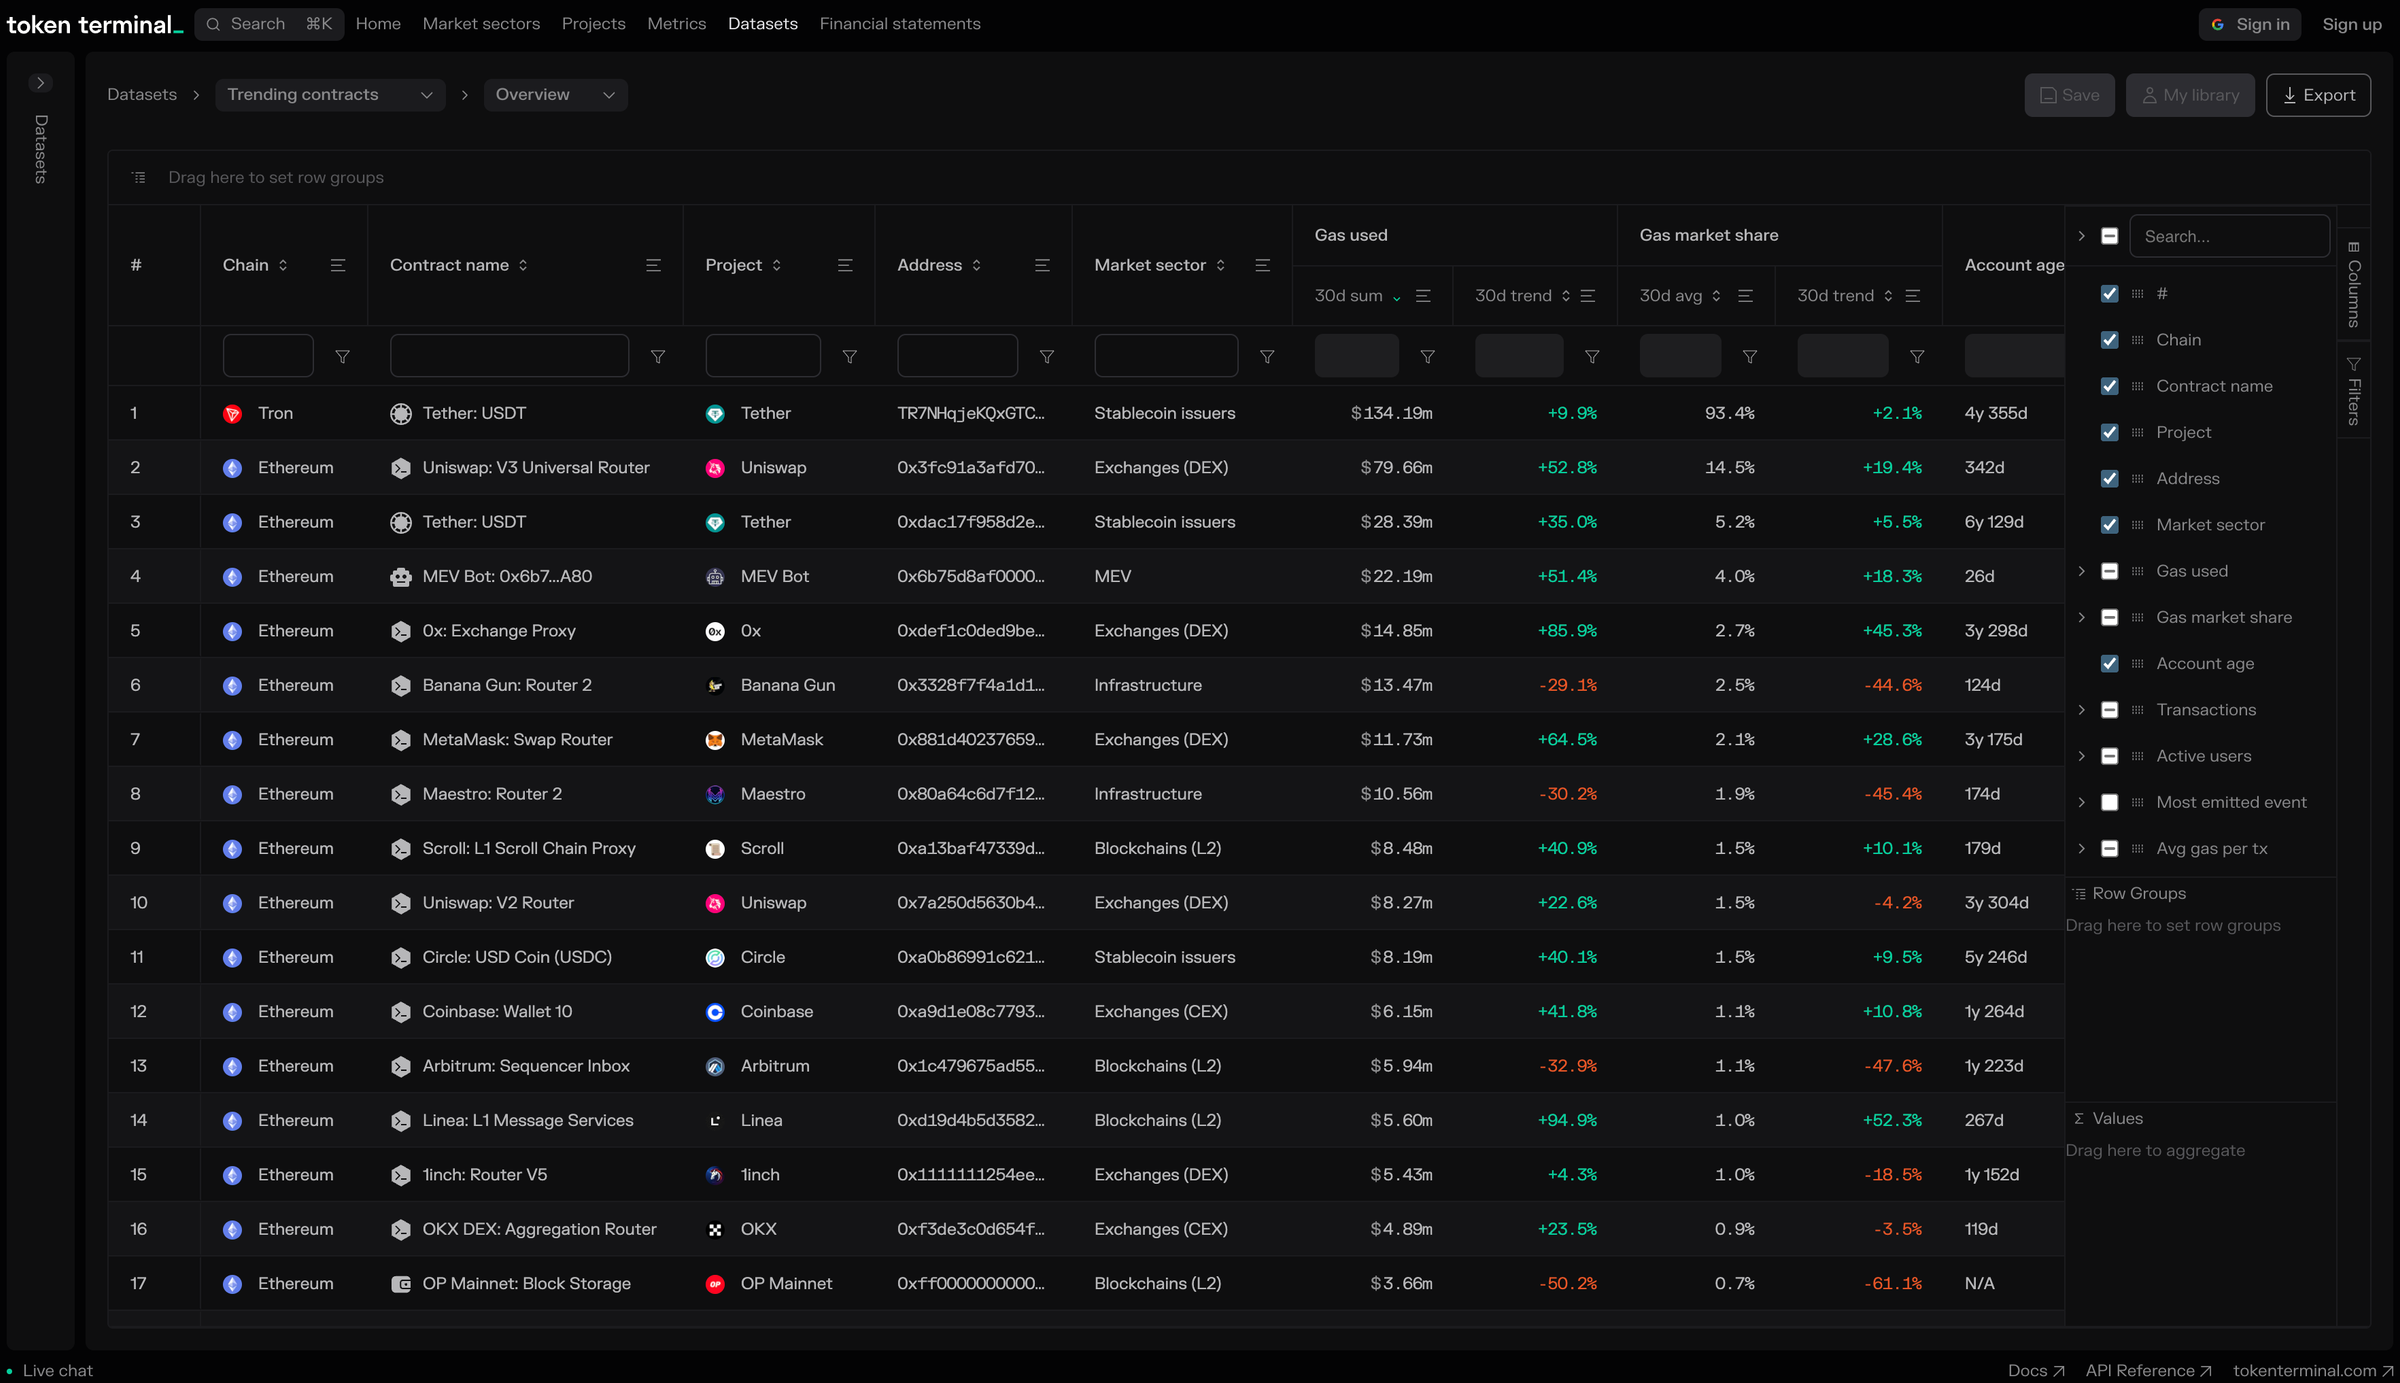
Investors can analyze the activity on different blockchains via our Trending contracts dataset.
To make another analogy to the non-crypto world, from an entrepreneur's perspective, when you think of where to launch a company, you think of which jurisdiction you want to launch it in, i.e. which jurisdiction has the best legal and operational environment for you to incorporate that company in. From a Web3 perspective, entrepreneurs need to think of what the best blockchain is for them to deploy their smart contracts to, i.e. which platform provides the best environment to operate and grow.
Are crypto and tradfi metrics a like-for-like?
Alex (Bloomberg):
What I think is amazing about what you do at Token Terminal is the way that you translate raw onchain data, that differs a lot from platform to platform, into comparable metrics that traditional finance understands from equity analysis. But is this really a like for like? What kind of assumptions do you need to make to get to that level of equivalence?
Oskari (Token Terminal):
In general, both blockchains and the applications built on top of them are conceptually similar to traditional marketplace companies.
You build a platform that seamlessly connects supply-side and demand-side participants.
You convince the demand side to pay that supply-side a fee for the service that they get.
You capture a portion of the total fees generated as revenue.
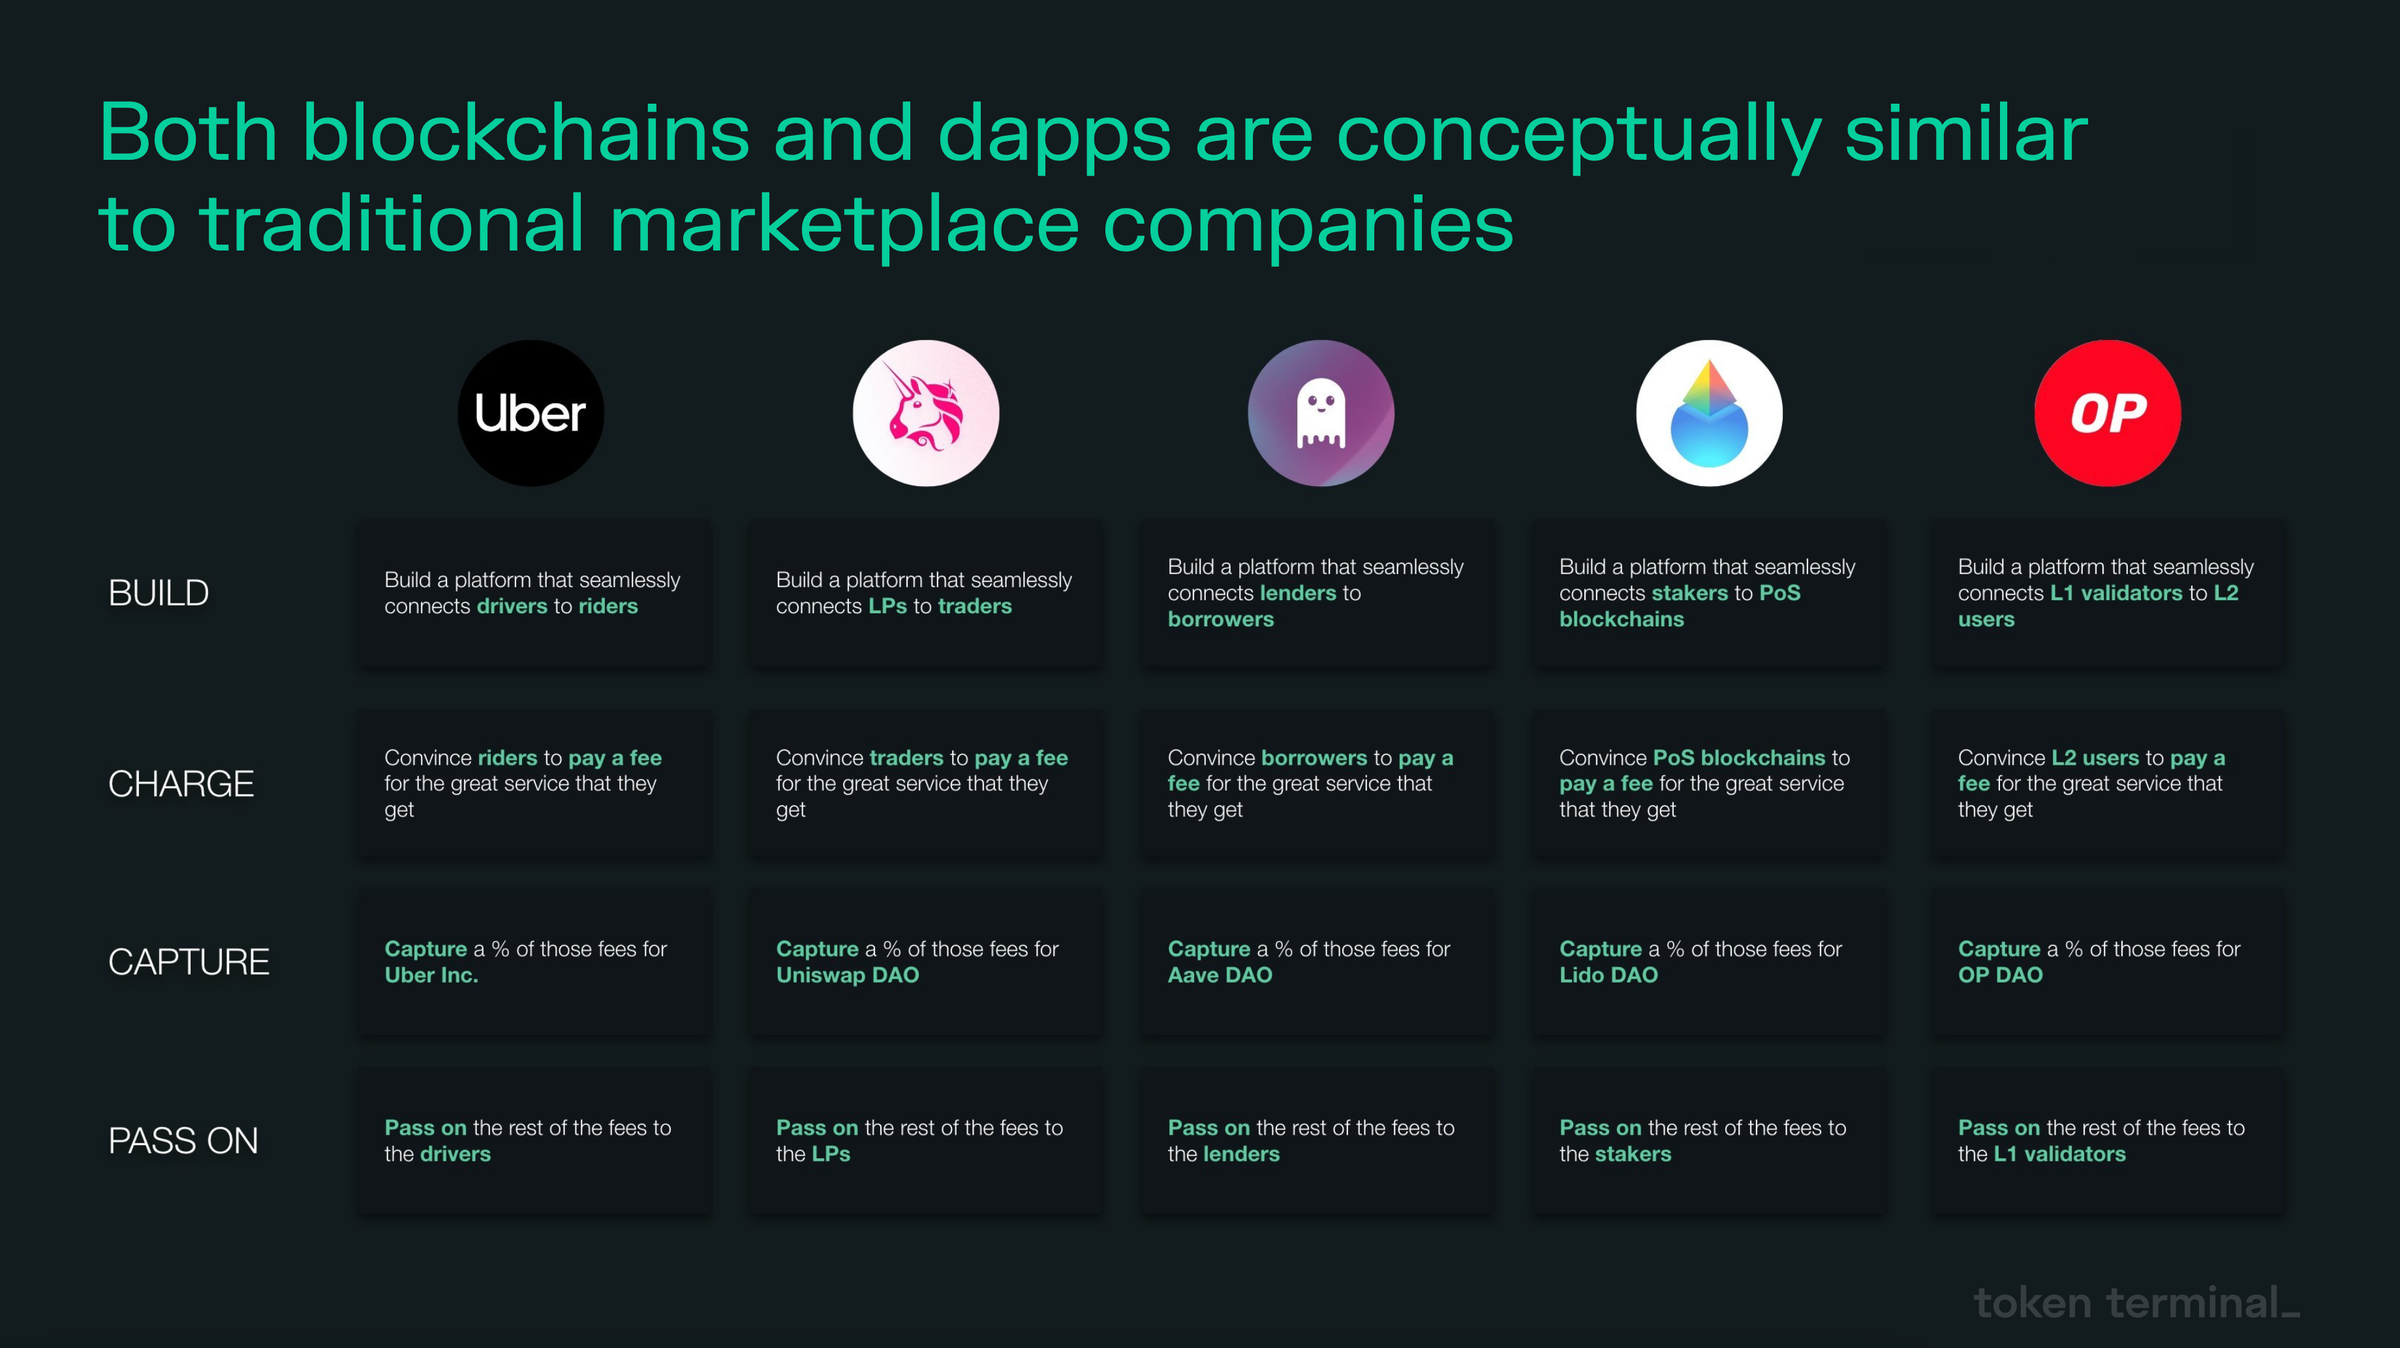
This applies to both Ethereum and Solana as they’re selling blockspace, and applications like Compound or Uniswap that are providing lending or exchange services.
So even though there are no 1-1 benchmarks for some of these assets, the business logic itself is very straightforward and comparable.
However, as blockchains are permissionless platforms and smart contracts can be coded in many different ways, it’s sometimes challenging to standardize the metrics – but we get it done. We’re thankfully seeing the business logic in smart contracts increasingly converge to an “industry standard” format that is comparable with how traditional companies report their metrics.
How is onchain data being used by traditional finance firms today?
Alex (Bloomberg):
As Bloomberg primarily serves traditional clients, it would be great to get your perspective on some concrete examples or use cases that you're seeing today for the use of onchain data in traditional financial firms.
Oskari (Token Terminal):
As of today, we’re still quite early on the journey of investors understanding the whole asset class of crypto. I’d say we’re approaching the point where people are starting to understand that crypto assets are internet native companies that can be valued based on fundamentals.
The investors who get this today, are using onchain data to power:
Research: Utilizing onchain metrics for in-depth analysis of protocols’ business logic, adoption rates, and network effects, offering a comparative lens against traditional financial entities.
Valuation models: Powering sophisticated valuation and investment underwriting engines with real-time data feeds.
Portfolio monitoring: Enhancing portfolio management through the continuous stream of transaction-level data.
Case example: Coinbase
Let's take Coinbase as an example, which, while operating in the crypto market, is mainly a traditional fintech company. Coinbase operates onchain business lines that include staking services, and their own Layer 2 blockchain, Base.
As an analyst trying to value Coinbase, it’s tough to understand the nuances of what’s going on under the hood from their quarterly reports, where for example their Layer 2 blockchain is grouped under the “Other” category on their financial statements.
Traditional investors might leverage onchain data to gain an edge on the market by opening up Base’s dashboard on Token Terminal, examining its key metrics on a daily granularity, and benchmarking its performance against competing Layer 2 blockchains. This data can then be used to support modeling out revenue and growth projections for Coinbase, without the need to wait for quarterly reports.

Base's Revenue and MAUs since launch.
To quantify the opportunity here, Base is currently generating around $500k in daily transaction fee revenue, with 1.2 million monthly active addresses. For reference, Coinbase's centralized exchange has around 7-8M monthly active users.
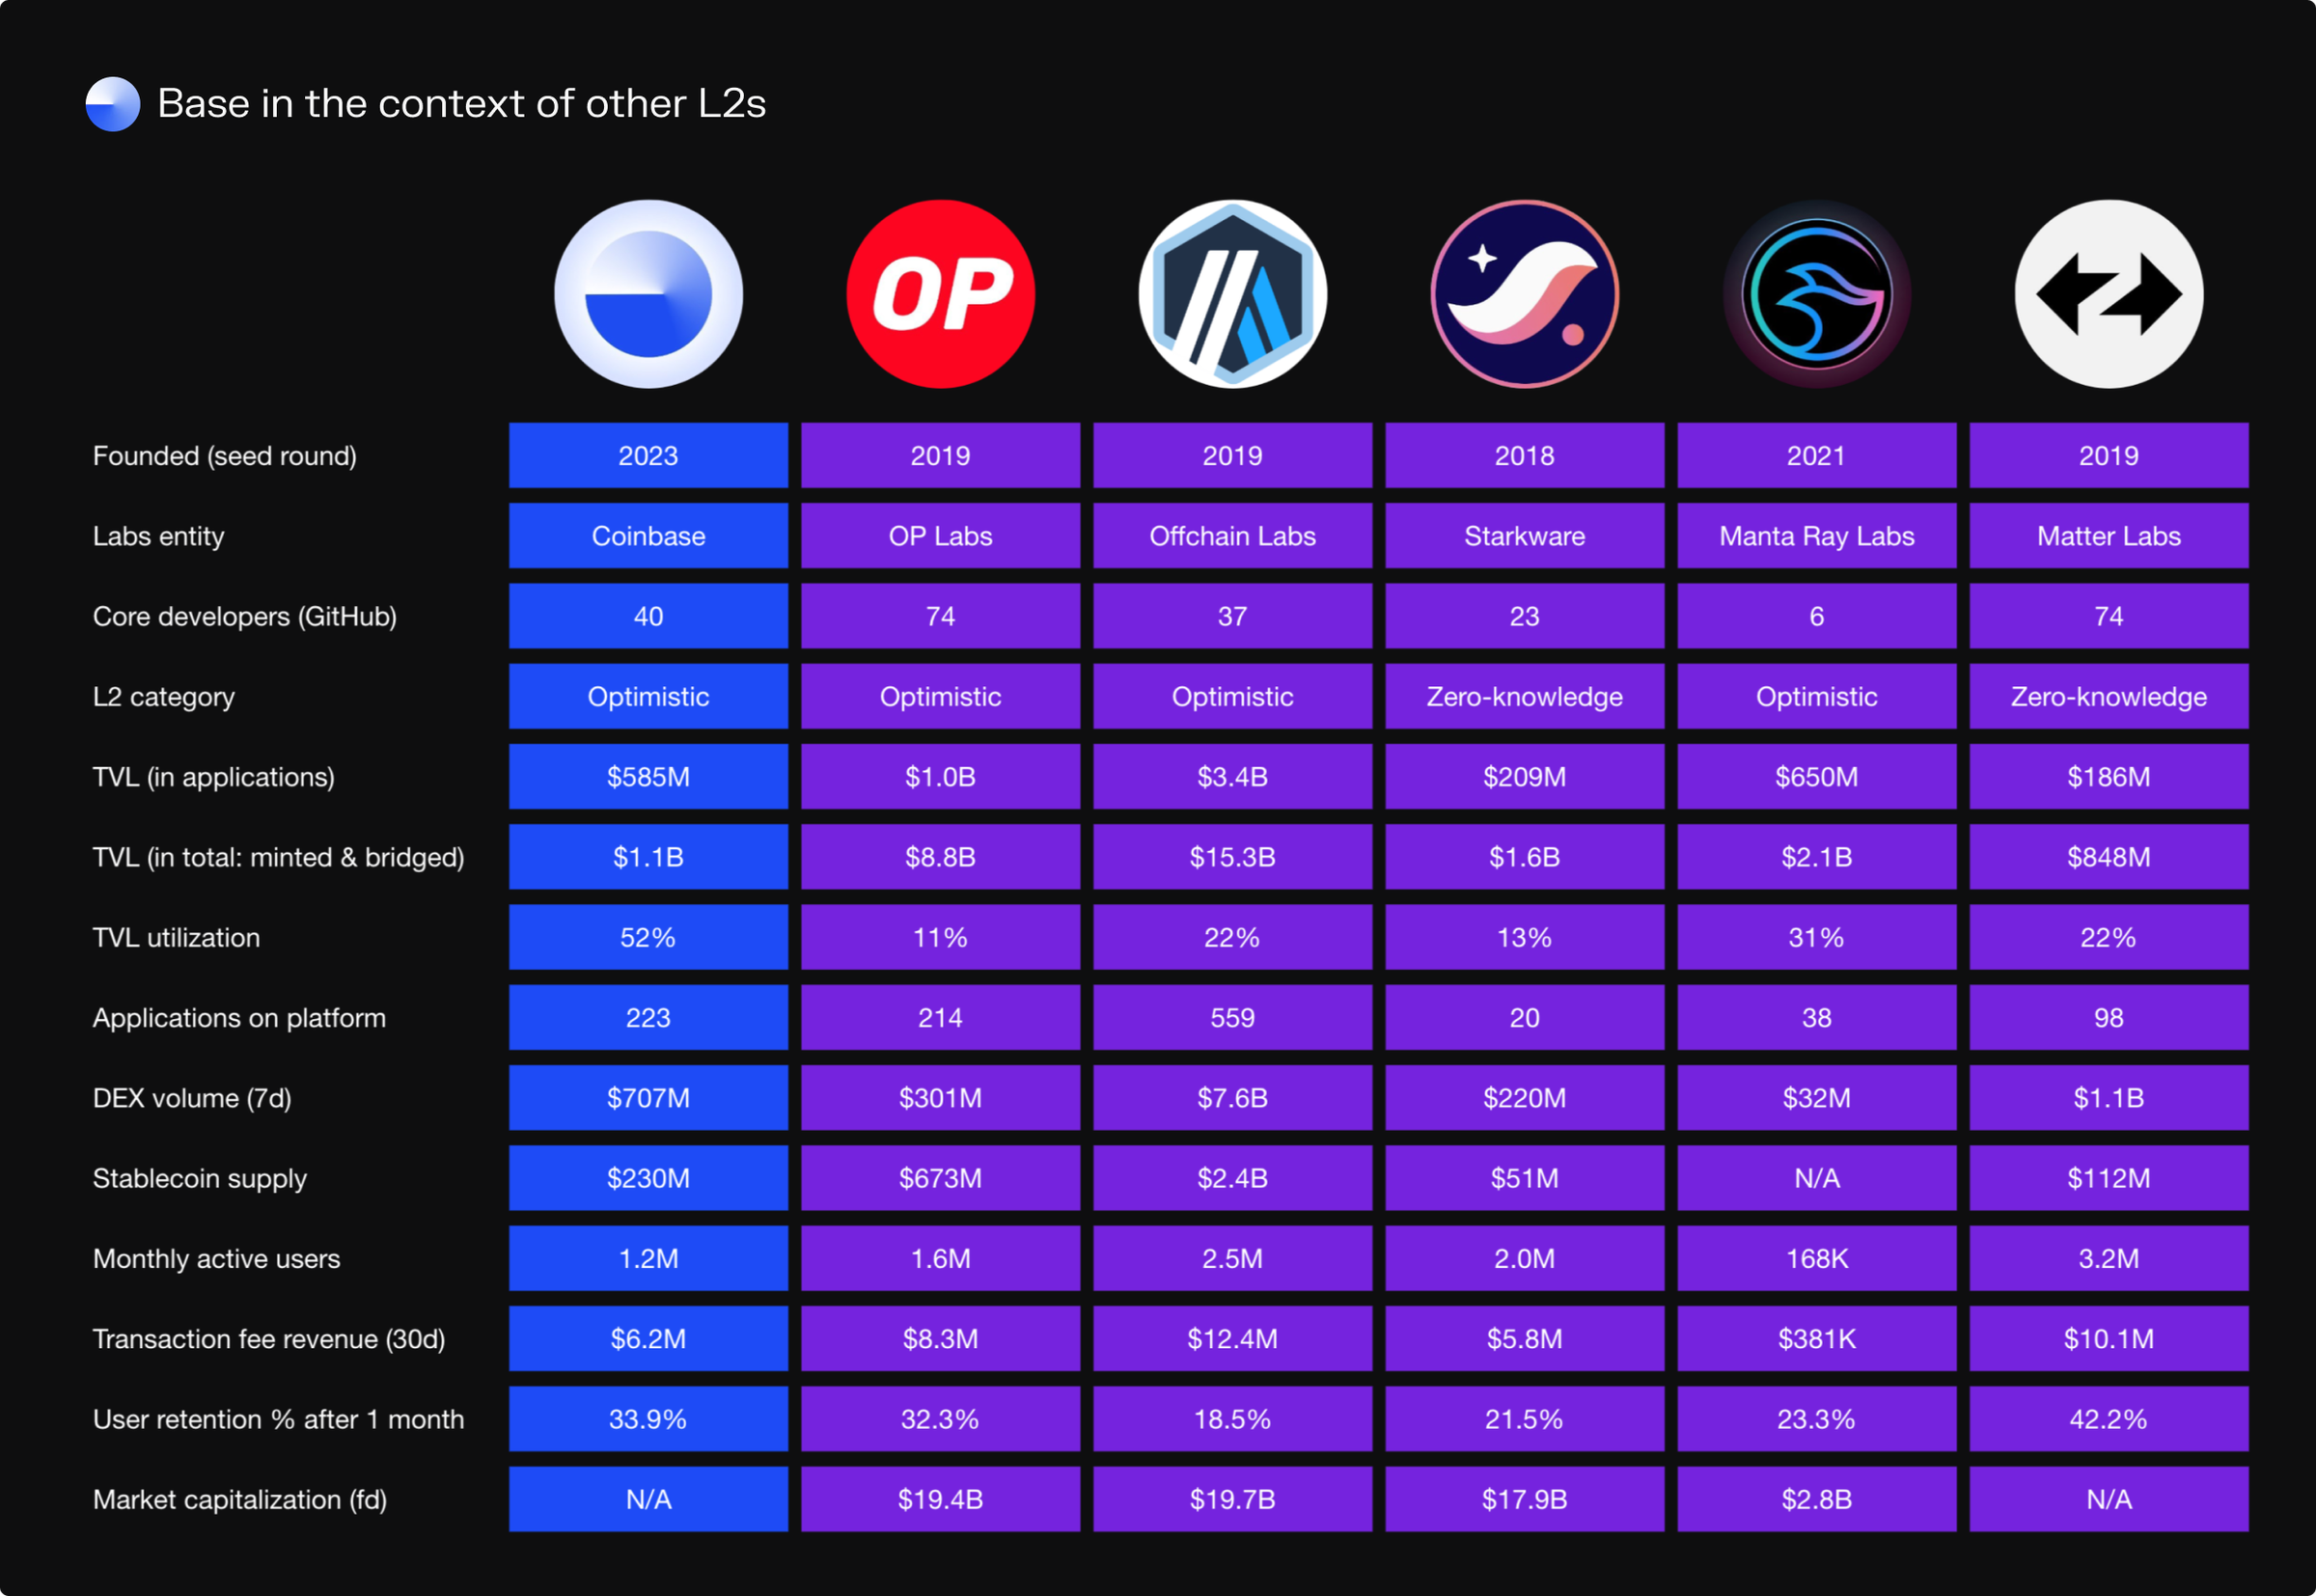
Base alongside other leading Ethereum L2s.
The leading Layer 2 blockchains in the market today like Arbitrum and OP Mainnet, which in terms of revenue and user activity are in the same ballpark as Base, are sitting at $20b fully-diluted valuations.
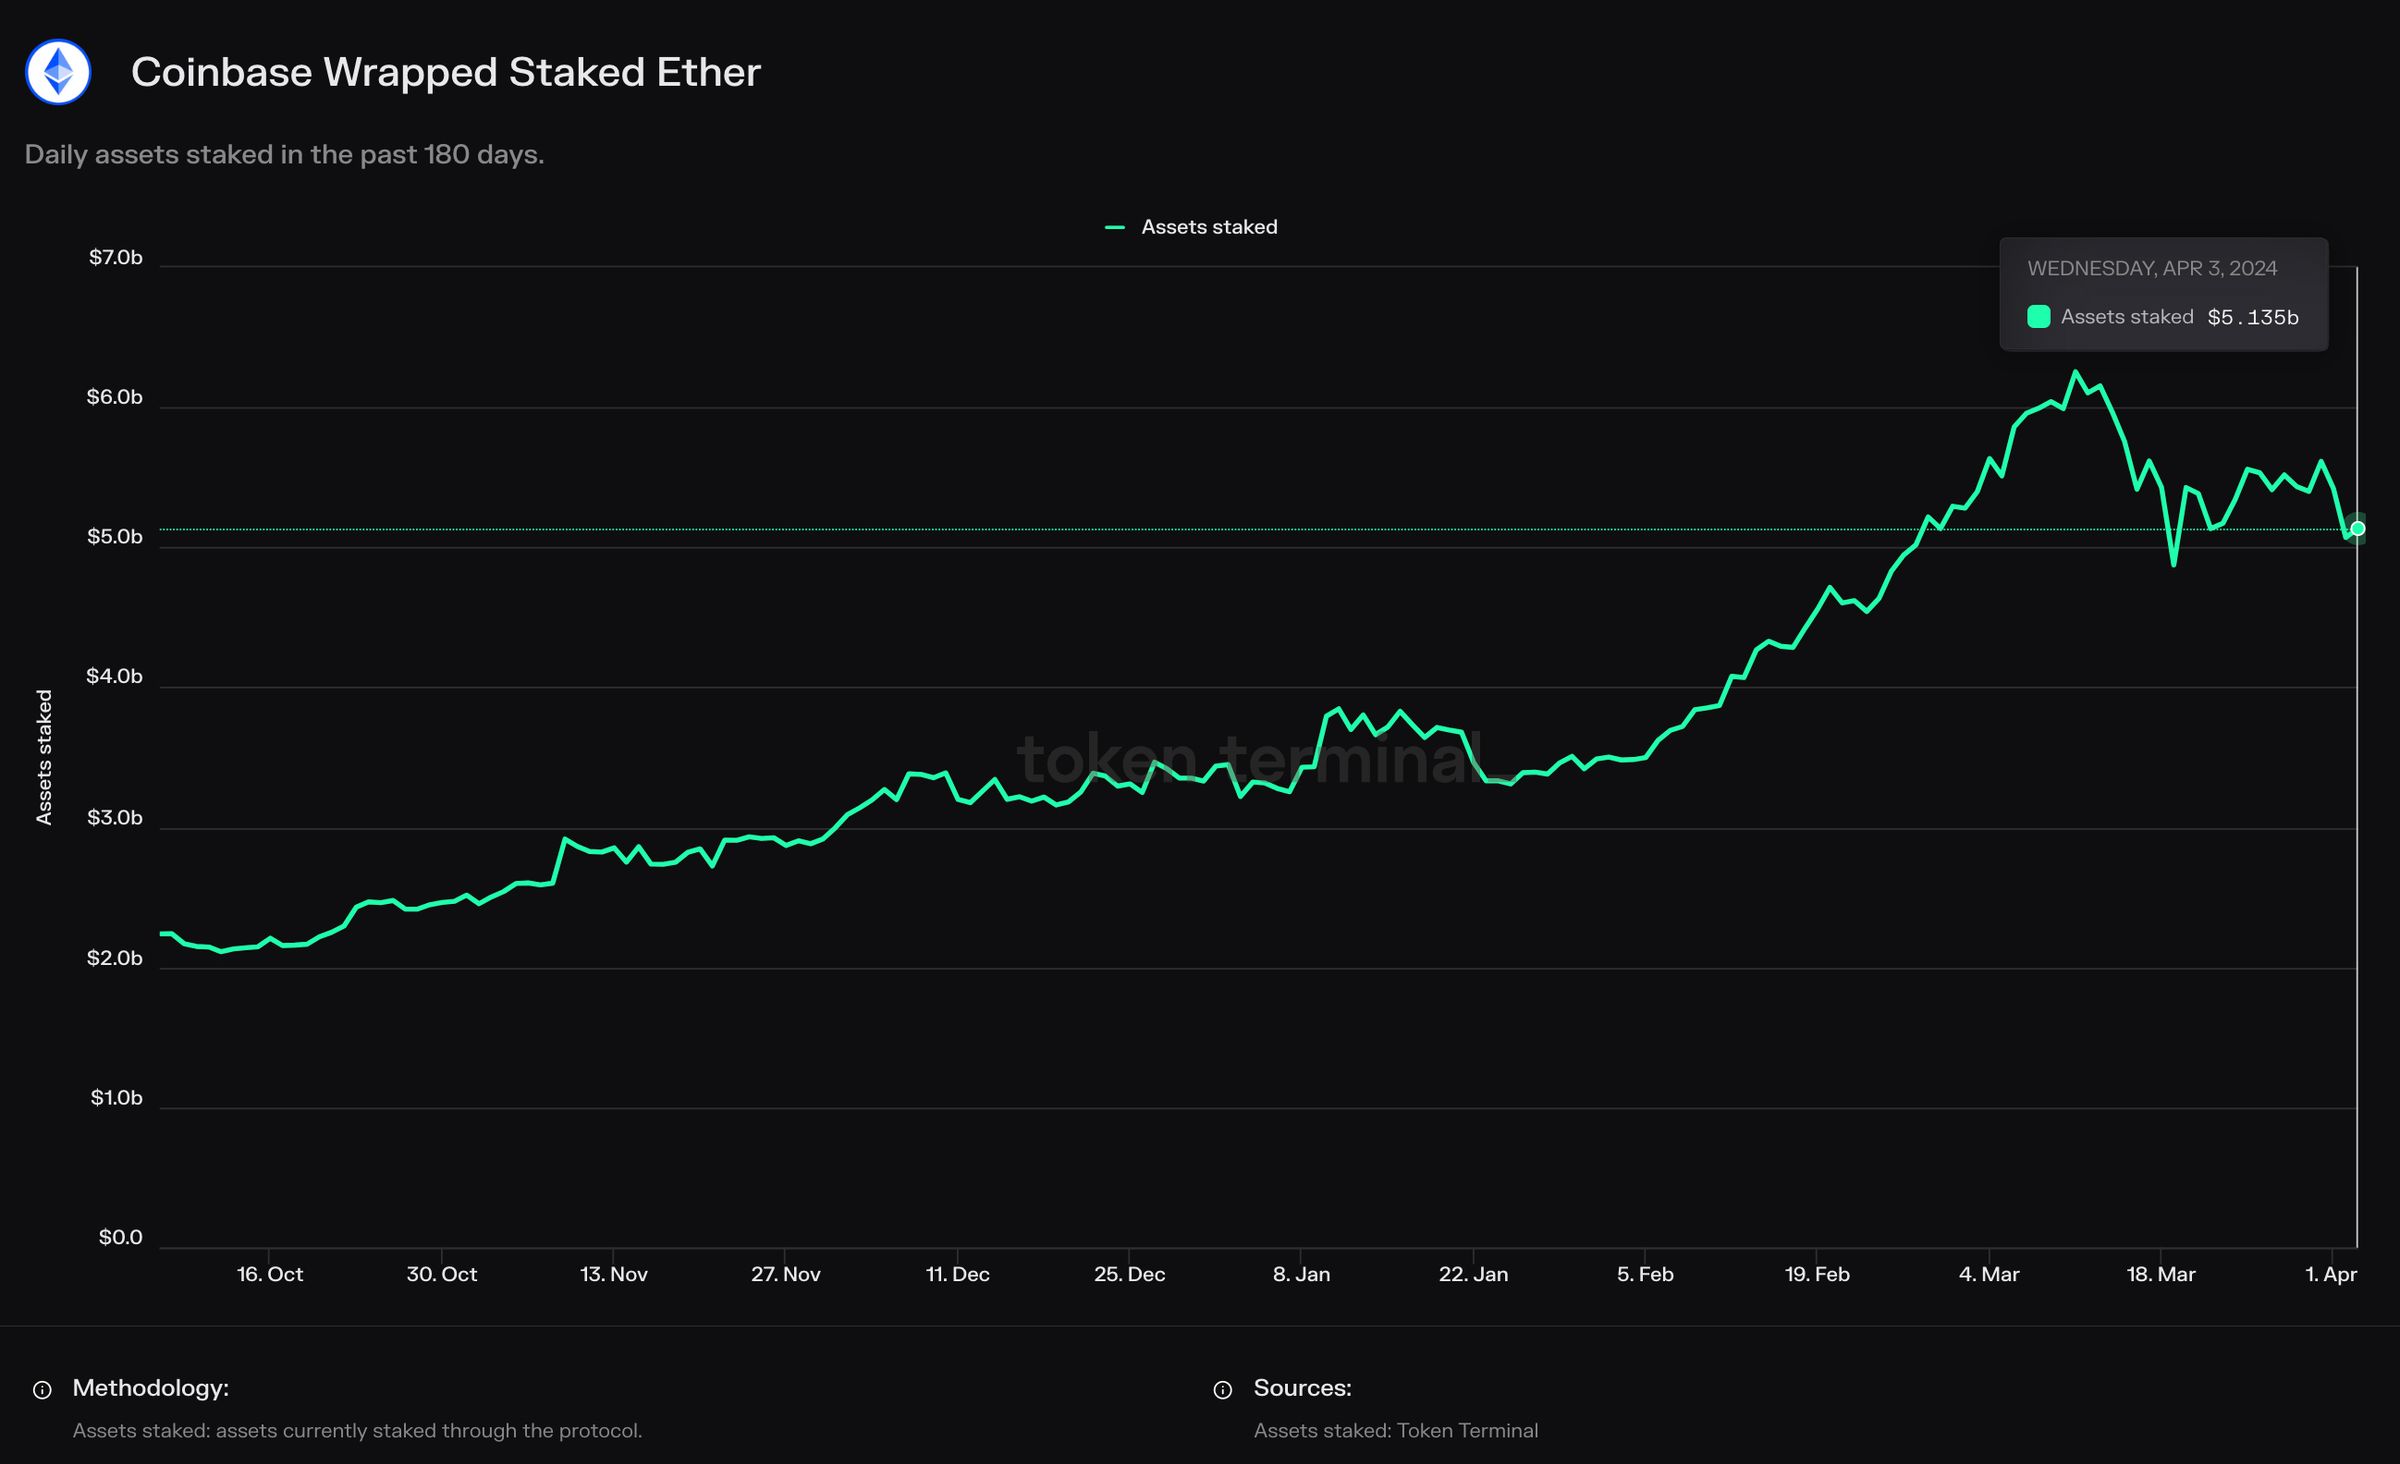
Daily daily assets staked in the past 180 days.
At the same time, Coinbase is one of the largest liquid staking providers on Ethereum, with over 4.5million ETH staked. Analysts can follow how the amount of assets staked through Coinbase develops onchain, block-by-block.
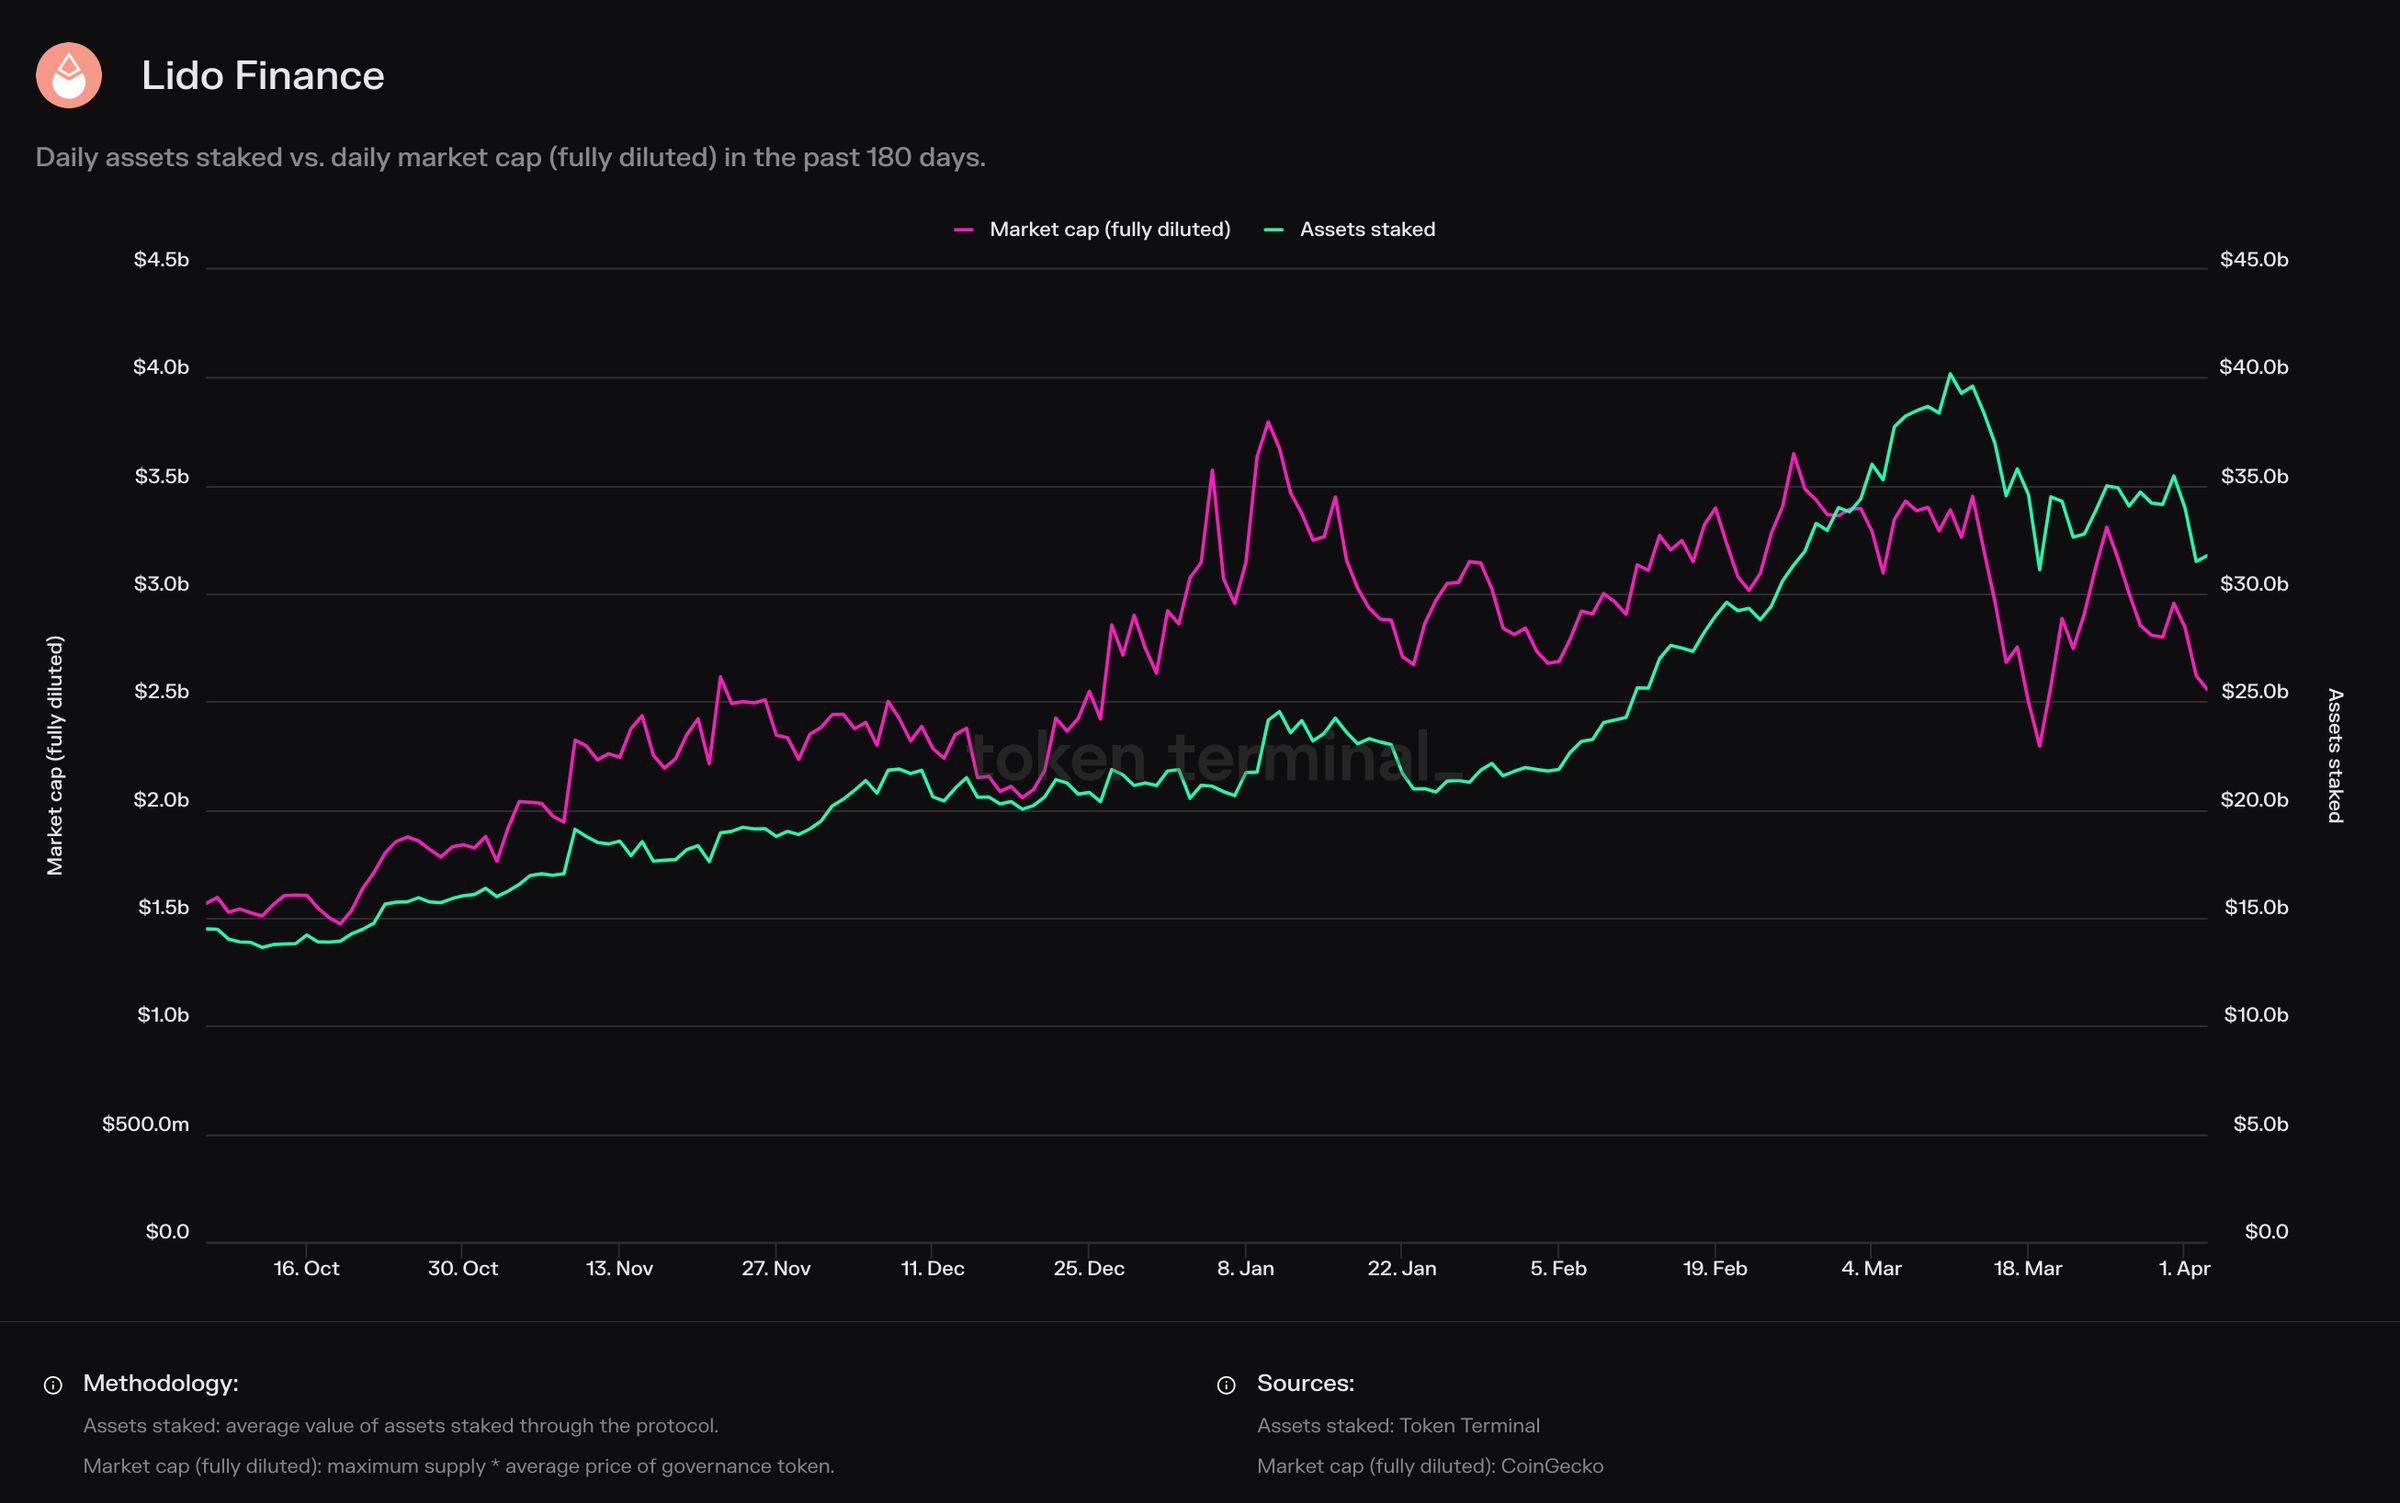
Daily assets staked vs. daily market cap (fully diluted) in the past 180 days.
The current liquid staking market leader is Lido Finance, with over 9m ETH staked, and is currently valued at a $3.4b fully diluted market cap.
Coinbase's onchain business could be argued to be worth billions of dollars, and the data for these is available in near real-time for anyone to assess in real time.
While Coinbase is obviously a pioneer on this front, we’re seeing more and more companies, starting from fintech, build products onchain. For example, Robinhood announced they are partnering with the Layer 2 blockchain Arbitrum, to offer onchain swaps for users. And we already have PayPal with their stablecoin PYUSD, enabling users to pay with crypto and developers to use PYUSD as the payments layer to build new services and products on public blockchains.
Reddit has been experimenting with several onchain business lines, and they're about to IPO. There's also Circle, the second largest stablecoin issuer in the market, that's about to IPO as well. You can assess all USDC flows and adoption onchain.
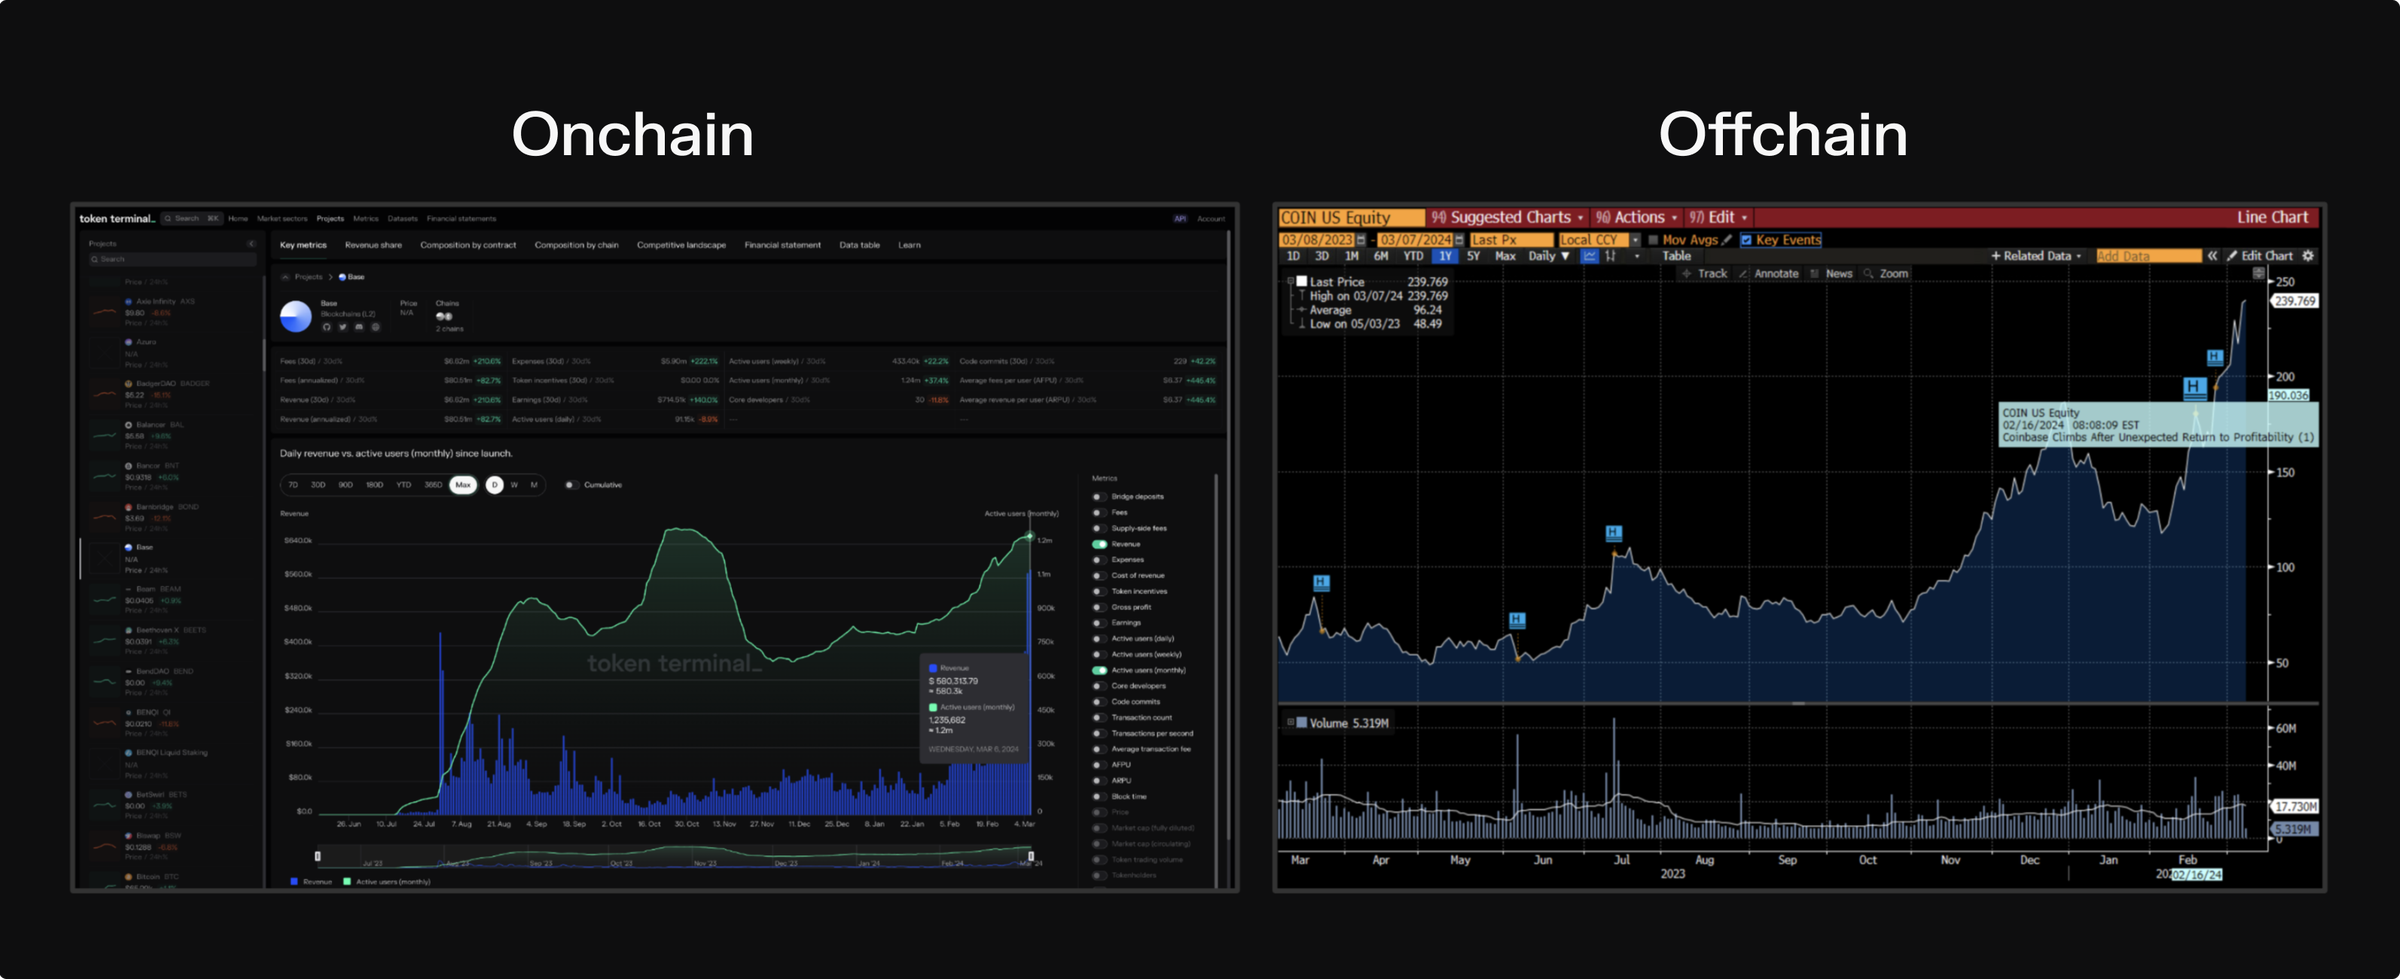
As these companies start to build products onchain, this data will be available on Token Terminal first.